正在加载图片...
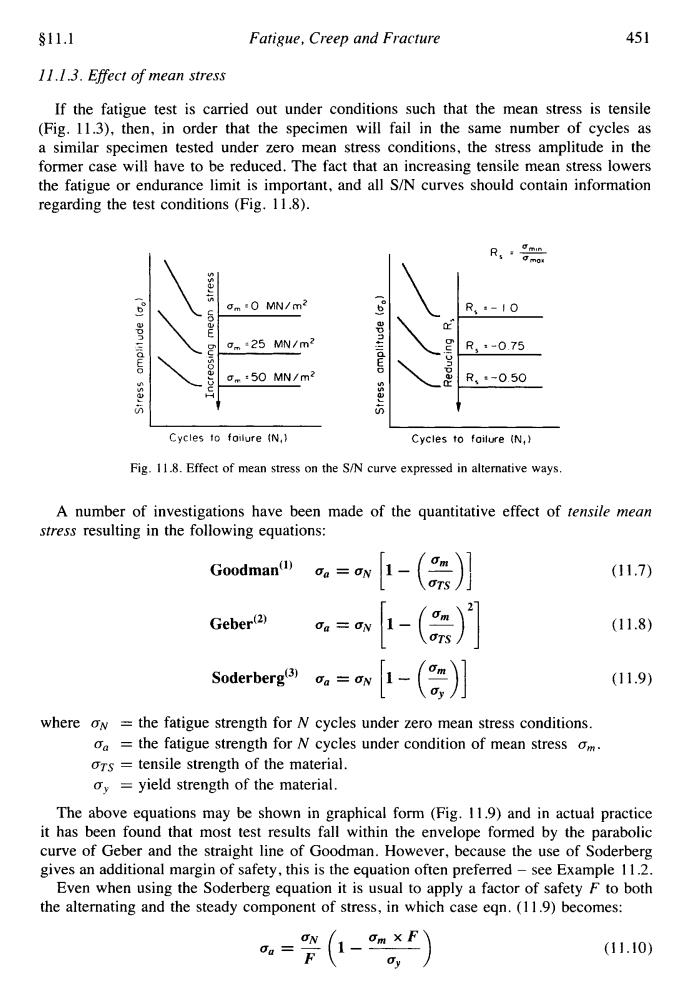
§11.1 Fatigue,Creep and Fracture 451 11.1.3.Effect of mean stress If the fatigue test is carried out under conditions such that the mean stress is tensile (Fig.11.3),then,in order that the specimen will fail in the same number of cycles as a similar specimen tested under zero mean stress conditions,the stress amplitude in the former case will have to be reduced.The fact that an increasing tensile mean stress lowers the fatigue or endurance limit is important,and all S/N curves should contain information regarding the test conditions (Fig.11.8). :) m0 MN/m2 R,4-10 正 apn ldwo om25 MN/m2 R,-0.75 m:50 MN/m2 R、-0.50 Cycles to foilure (N,) Cycles to failure (N, Fig.11.8.Effect of mean stress on the S/N curve expressed in alternative ways. A number of investigations have been made of the quantitative effect of tensile mean stress resulting in the following equations: Goodman() da =ON -( (11.7) Geber(2) 1-(=)月 (11.8) Soderberg(3) 1-(,月 (11.9) where oN =the fatigue strength for N cycles under zero mean stress conditions. o the fatigue strength for N cycles under condition of mean stress om. ors tensile strength of the material. oy =yield strength of the material. The above equations may be shown in graphical form (Fig.11.9)and in actual practice it has been found that most test results fall within the envelope formed by the parabolic curve of Geber and the straight line of Goodman.However,because the use of Soderberg gives an additional margin of safety,this is the equation often preferred-see Example 11.2. Even when using the Soderberg equation it is usual to apply a factor of safety F to both the alternating and the steady component of stress,in which case eqn.(11.9)becomes: =%(1-x (11.10)911.1 Fatigue, Creep and Fracture 45 1 11 .I .3. Effect of mean stress If the fatigue test is carried out under conditions such that the mean stress is tensile (Fig. 11.3), then, in order that the specimen will fail in the same number of cycles as a similar specimen tested under zero mean stress conditions, the stress amplitude in the former case will have to be reduced. The fact that an increasing tensile mean stress lowers the fatigue or endurance limit is important, and all S/N curves should contain information regarding the test conditions (Fig. 11.8). VI - ?! "l C W E c u 0 2 H C t R, *-0 75 R, =-0 50 I I Cycles to failure (N,) Cycles to failure (N,) Fig. 1 1.8. Effect of mean stress on the SIN curve expressed in alternative ways. A number of investigations have been made of the quantitative effect of tensile mean stress resulting in the following equations: Goodman(') a, = UN (11.7) S~derberg(~) a, = UN [I - (z)] (11.8) (11.9) where ON = the fatigue strength for N cycles under zero mean stress conditions. a, = the fatigue strength for N cycles under condition of mean stress a,. CTTS = tensile strength of the material. cry = yield strength of the material. The above equations may be shown in graphical form (Fig. 11.9) and in actual practice it has been found that most test results fall within the envelope formed by the parabolic curve of Geber and the straight line of Goodman. However, because the use of Soderberg gives an additional margin of safety, this is the equation often preferred - see Example 1 1.2. Even when using the Soderberg equation it is usual to apply a factor of safety F to both the alternating and the steady component of stress, in which case eqn. (1 1.9) becomes: (1 1.10)