正在加载图片...
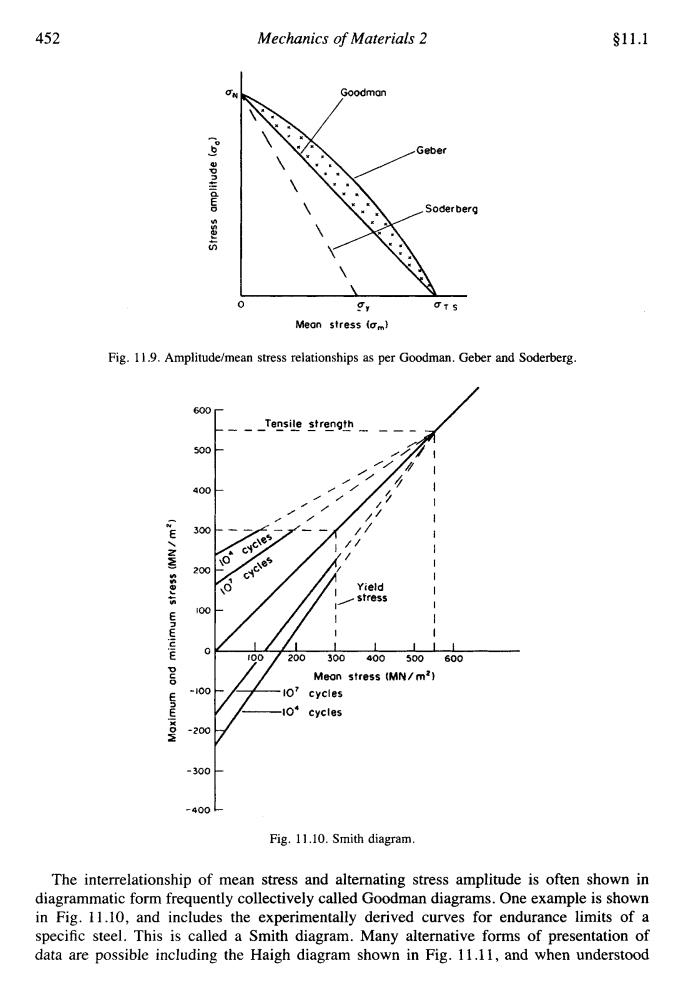
452 Mechanics of Materials 2 §11.1 Goodman g Geber Soderberg gy Mean stres5igm】 Fig.11.9.Amplitude/mean stress relationships as per Goodman.Geber and Soderberg. 600 _Tensile strength 500 400 1 300 cycles 1 0 200 cycles 6 Yield stress 100 100 200300 400 500600 Meon stress (MN/m2) =100 IO7 cycles 0¥ cycles -200 -300 -400 Fig.11.10.Smith diagram. The interrelationship of mean stress and alternating stress amplitude is often shown in diagrammatic form frequently collectively called Goodman diagrams.One example is shown in Fig.11.10,and includes the experimentally derived curves for endurance limits of a specific steel.This is called a Smith diagram.Many alternative forms of presentation of data are possible including the Haigh diagram shown in Fig.11.11,and when understood452 Mechanics of Materials 2 $11.1 0 Pr Mean stress (urn) Fig. 11.9. Amplitude/mean stress relationships as per Goodman. Geber and Soderberg. 400 t I C I / / Meon stress (MN/m') io' cycles 10' cycles 5 -200 -400 -300 t Fig. 11 .lo. Smith diagram. The interrelationship of mean stress and alternating stress amplitude is often shown in diagrammatic form frequently collectively called Goodman diagrams. One example is shown in Fig. 11.10, and includes the experimentally derived curves for endurance limits of a specific steel. This is called a Smith diagram. Many alternative forms of presentation of data are possible including the Haigh diagram shown in Fig. 11.1 1, and when understood