正在加载图片...
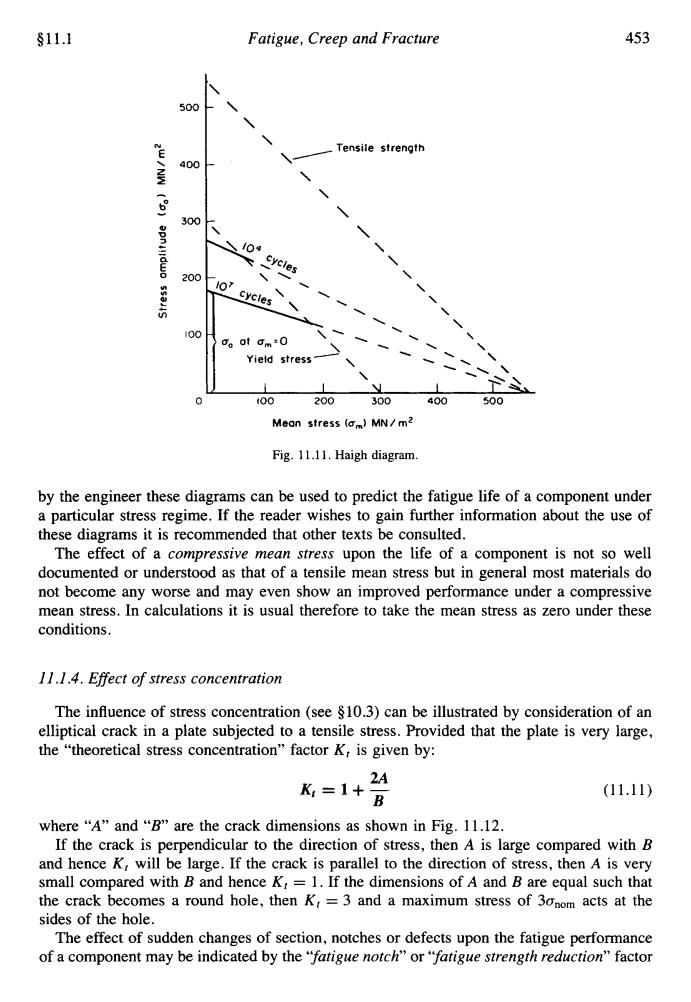
§11.1 Fatigue,Creep and Fracture 453 500 Tensile strength 400 300 04 dwo cycles 200 107 cycles 400 o at am0 Yield stress 100 200 300 400 500 Mean stress (am)MN/m2 Fig.11.11.Haigh diagram. by the engineer these diagrams can be used to predict the fatigue life of a component under a particular stress regime.If the reader wishes to gain further information about the use of these diagrams it is recommended that other texts be consulted. The effect of a compressive mean stress upon the life of a component is not so well documented or understood as that of a tensile mean stress but in general most materials do not become any worse and may even show an improved performance under a compressive mean stress.In calculations it is usual therefore to take the mean stress as zero under these conditions. 11.1.4.Effect of stress concentration The influence of stress concentration (see $10.3)can be illustrated by consideration of an elliptical crack in a plate subjected to a tensile stress.Provided that the plate is very large, the "theoretical stress concentration"factor K:is given by: 2A K=1+B (11.11) where“A"and“B”are the crack dimensions as shown in Fig.ll.l2. If the crack is perpendicular to the direction of stress,then A is large compared with B and hence K,will be large.If the crack is parallel to the direction of stress,then A is very small compared with B and hence K,=1.If the dimensions of A and B are equal such that the crack becomes a round hole,then K,=3 and a maximum stress of 3onom acts at the sides of the hole. The effect of sudden changes of section,notches or defects upon the fatigue performance of a component may be indicated by the "fatigue notch"or"fatigue strength reduction"factor$11.1 \\ Yield stress- \ \ . \\ \\ \ \‘ \ \ Fatigue, Creep and Fracture 453 500 N E 400 I - bo - 300 0 0) c .- - n 200 VI r & ul 100 0 \ -\ \ Tensile strength \ \’ \ \ \ \ \ . \ Mean stress (urn) MN/mz Fig. 11.1 1. Haigh diagram. by the engineer these diagrams can be used to predict the fatigue life of a component under a particular stress regime. If the reader wishes to gain further information about the use of these diagrams it is recommended that other texts be consulted. The effect of a compressive mean stress upon the life of a component is not so well documented or understood as that of a tensile mean stress but in general most materials do not become any worse and may even show an improved performance under a compressive mean stress. In calculations it is usual therefore to take the mean stress as zero under these conditions. 1 I .I .4. Effect of stress concentration The influence of stress concentration (see 910.3) can be illustrated by consideration of an elliptical crack in a plate subjected to a tensile stress. Provided that the plate is very large, the “theoretical stress concentration” factor K, is given by: 2A Kf=l+B (11.11) where “A” and “B’ are the crack dimensions as shown in Fig. 1 1.12. If the crack is perpendicular to the direction of stress, then A is large compared with B and hence K, will be large. If the crack is parallel to the direction of stress, then A is very small compared with B and hence K, = 1. If the dimensions of A and B are equal such that the crack becomes a round hole, then Kt = 3 and a maximum stress of 3an,, acts at the sides of the hole. The effect of sudden changes of section, notches or defects upon the fatigue performance of a component may be indicated by the “fatigue notch” or “fatigue strength reduction” factor