正在加载图片...
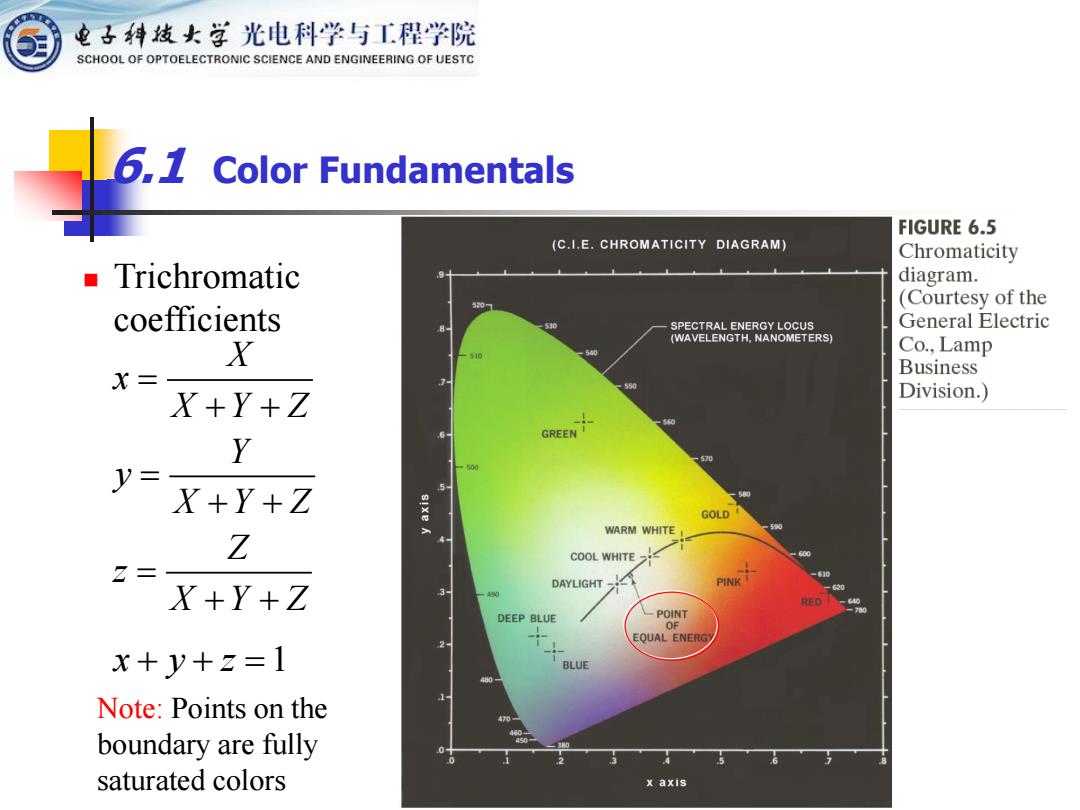
电子科技女学光电科学与工程学院 SCHOOL OF OPTOELECTRONIC SCIENCE AND ENGINEERING OF UESTC 6,1 Color Fundamentals FIGURE 6.5 (C.I.E.CHROMATICITY DIAGRAM) Chromaticity ■Trichromatic diagram. 530 (Courtesy of the coefficients SPECTRAL ENERGY LOCUS General Electric (WAVELENGTH,NANOMETERS) X Co.,Lamp X= Business X+Y+Z Division.) Y 570 y= X+Y+Z GOLD WARM WHITE Z COOL WHITE Z= DAYLIGHT-1 PINK X+Y+Z 69 4 RED DEEP BLUE POINT OF EQUAL ENERG x+y+z=1 BLUE Note:Points on the boundary are fully saturated colors x axis6.1 Color Fundamentals ◼ Trichromatic coefficients X x X Y Z Y y X Y Z Z z X Y Z = + + = + + = + + x + y + z =1 Note: Points on the boundary are fully saturated colors