正在加载图片...

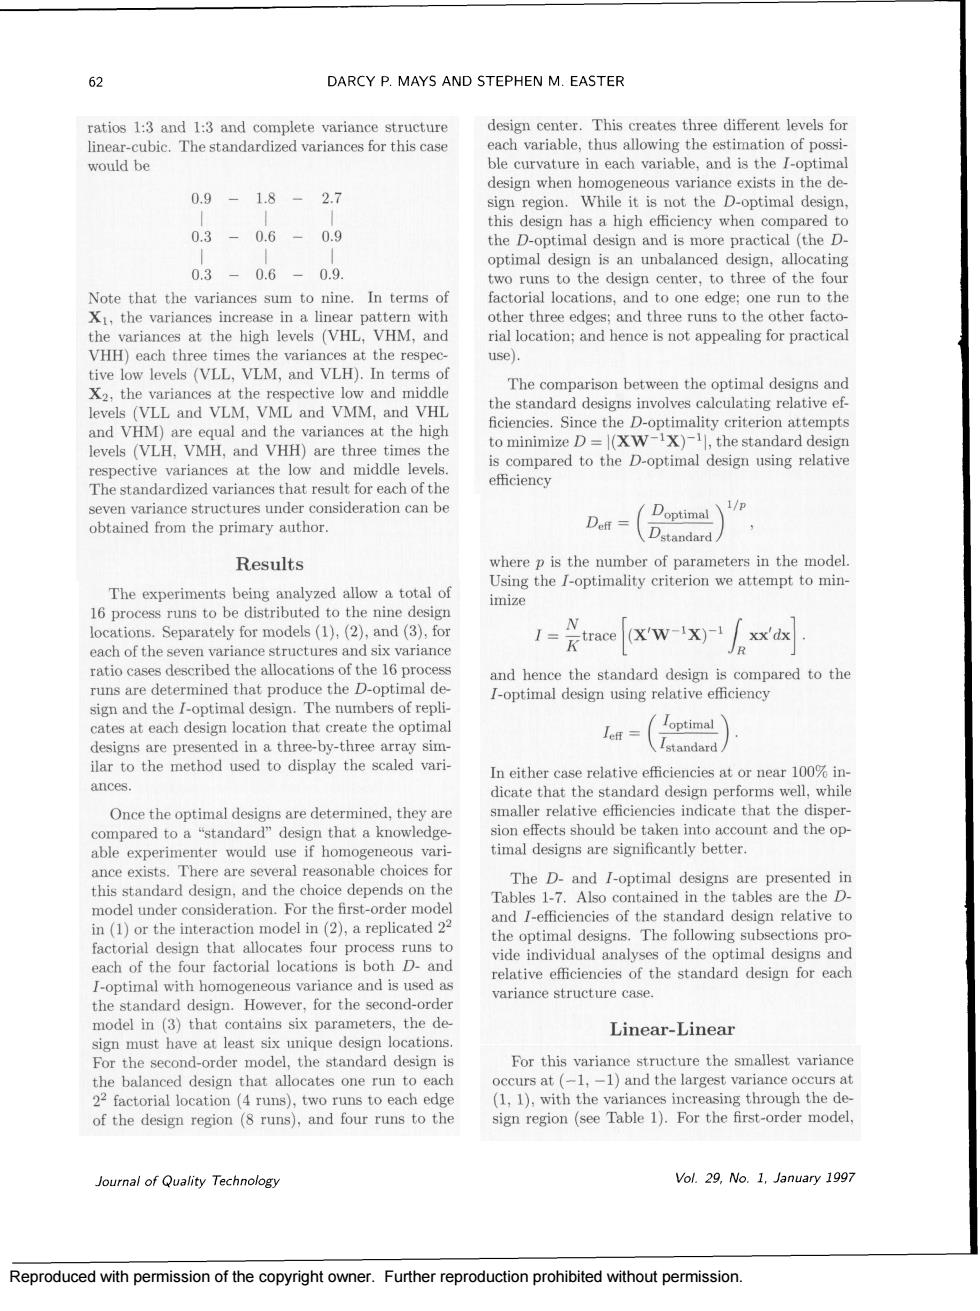
62 DARCY P.MAYS AND STEPHEN M.EASTER ratios 1:3 and 1:3 and complete variance structure design center.This creates three different levels for linear-cubic.The standardized variances for this case would be 0.9- 1.8-2.7 io the D-optimal de 0.3-0.6-0.9 this 0.3-0.6-09 optimal design is an unbalanced design,allocating In terms o 5,a d thre the variances at the high levels (VHL.VHM.and rial location:and hence is not appealing for practical use). at the ective low and middle an the standard designs involves calculating relative ef empt Thetandadodrianesthatresutorachofthe obtained fom the primary author. () Results wher ters in the mode The experiments being analyzed allow a total of mize 1=rae[xw-x/人xx ratio cases described the allocations of the 16 proces the the standard desig is co optimal d a-( In either case relative efficiencies at or near 100%in dicate that the standard design performs well,whil Once the optimal designs are determined,they are timal designs are significantly better. ction model in ()replicated and /-efficiencies of the standard design relative to fac optimal designs.The following subsections pro runs to ide indiv the standard design However.for the second-order ariance structure case model in (3)that contains six parameters, the Linear-Linear sign mus dor model.the standard design is For this variance structure the smallest variance balanced design that allocates one rn to each ccurs at(-1,-1)and the largest variance occurs a odel Journal of Quality Technology Vol.29.No.1.January 1997 Reproduced with permission of the copyright owner Further reproduction prohibited without permissior Reproduced with permission of the copyright owner. Further reproduction prohibited without permission