正在加载图片...

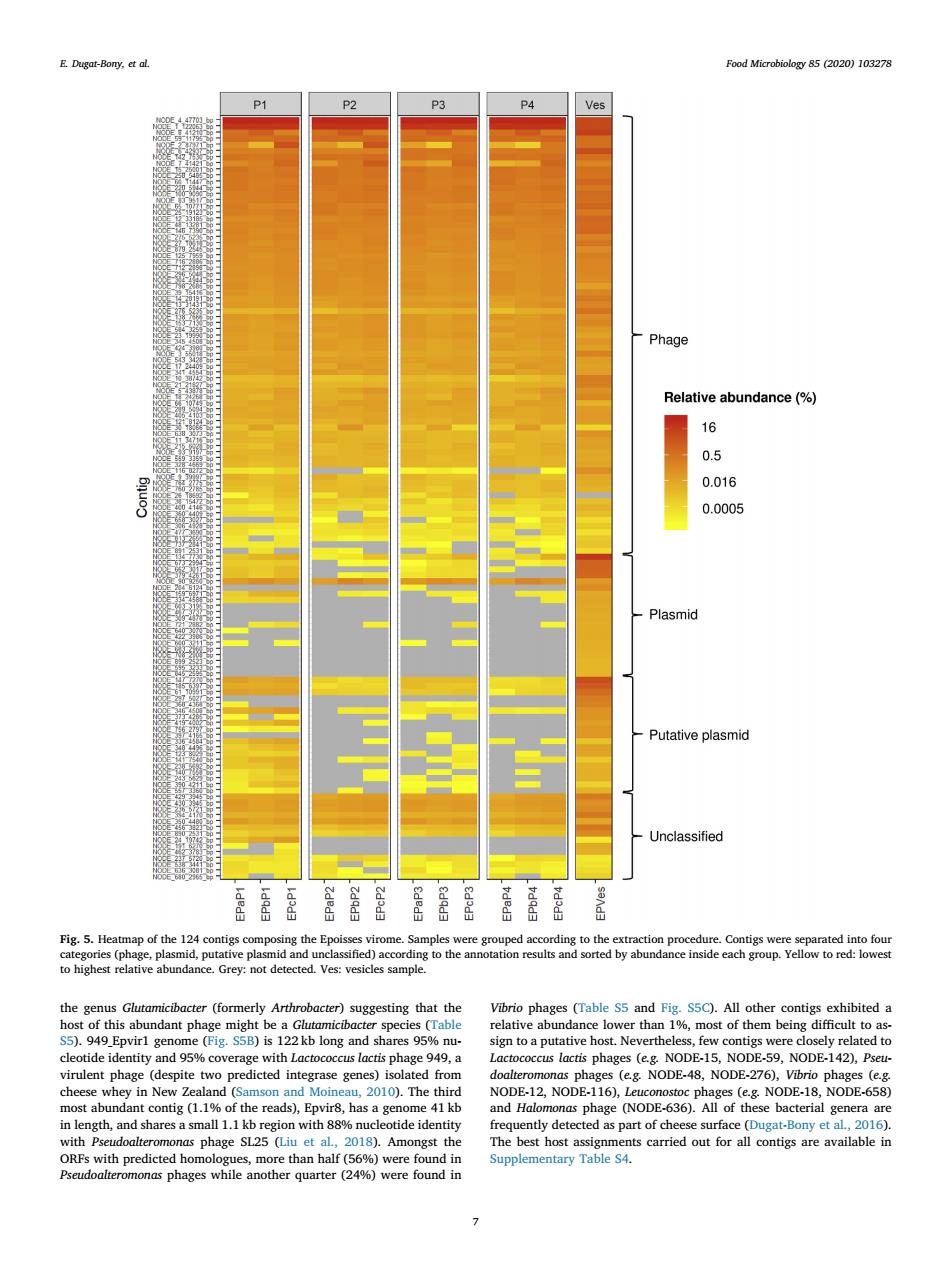
E.Dgat-Bony.ad Food Microbiology 85 (2020)103278 P2 Phage Relative abundance(%) 16 0.5 0.016 0.0005 Plasmid -Putative plasmid Unclassified of the 1 d and ned)ac d Ves acter)sugg sting that the ne (Fig.S e ce d fro (eg NODE-48,NODE-276 most abun nd Ha nas phage SL25 (Liu et 2018).Amongst the n phages whil another quarter )were found inthe genus Glutamicibacter (formerly Arthrobacter) suggesting that the host of this abundant phage might be a Glutamicibacter species (Table S5). 949_Epvir1 genome (Fig. S5B) is 122 kb long and shares 95% nucleotide identity and 95% coverage with Lactococcus lactis phage 949, a virulent phage (despite two predicted integrase genes) isolated from cheese whey in New Zealand (Samson and Moineau, 2010). The third most abundant contig (1.1% of the reads), Epvir8, has a genome 41 kb in length, and shares a small 1.1 kb region with 88% nucleotide identity with Pseudoalteromonas phage SL25 (Liu et al., 2018). Amongst the ORFs with predicted homologues, more than half (56%) were found in Pseudoalteromonas phages while another quarter (24%) were found in Vibrio phages (Table S5 and Fig. S5C). All other contigs exhibited a relative abundance lower than 1%, most of them being difficult to assign to a putative host. Nevertheless, few contigs were closely related to Lactococcus lactis phages (e.g. NODE-15, NODE-59, NODE-142), Pseudoalteromonas phages (e.g. NODE-48, NODE-276), Vibrio phages (e.g. NODE-12, NODE-116), Leuconostoc phages (e.g. NODE-18, NODE-658) and Halomonas phage (NODE-636). All of these bacterial genera are frequently detected as part of cheese surface (Dugat-Bony et al., 2016). The best host assignments carried out for all contigs are available in Supplementary Table S4. Fig. 5. Heatmap of the 124 contigs composing the Epoisses virome. Samples were grouped according to the extraction procedure. Contigs were separated into four categories (phage, plasmid, putative plasmid and unclassified) according to the annotation results and sorted by abundance inside each group. Yellow to red: lowest to highest relative abundance. Grey: not detected. Ves: vesicles sample. E. Dugat-Bony, et al. Food Microbiology 85 (2020) 103278 7