正在加载图片...
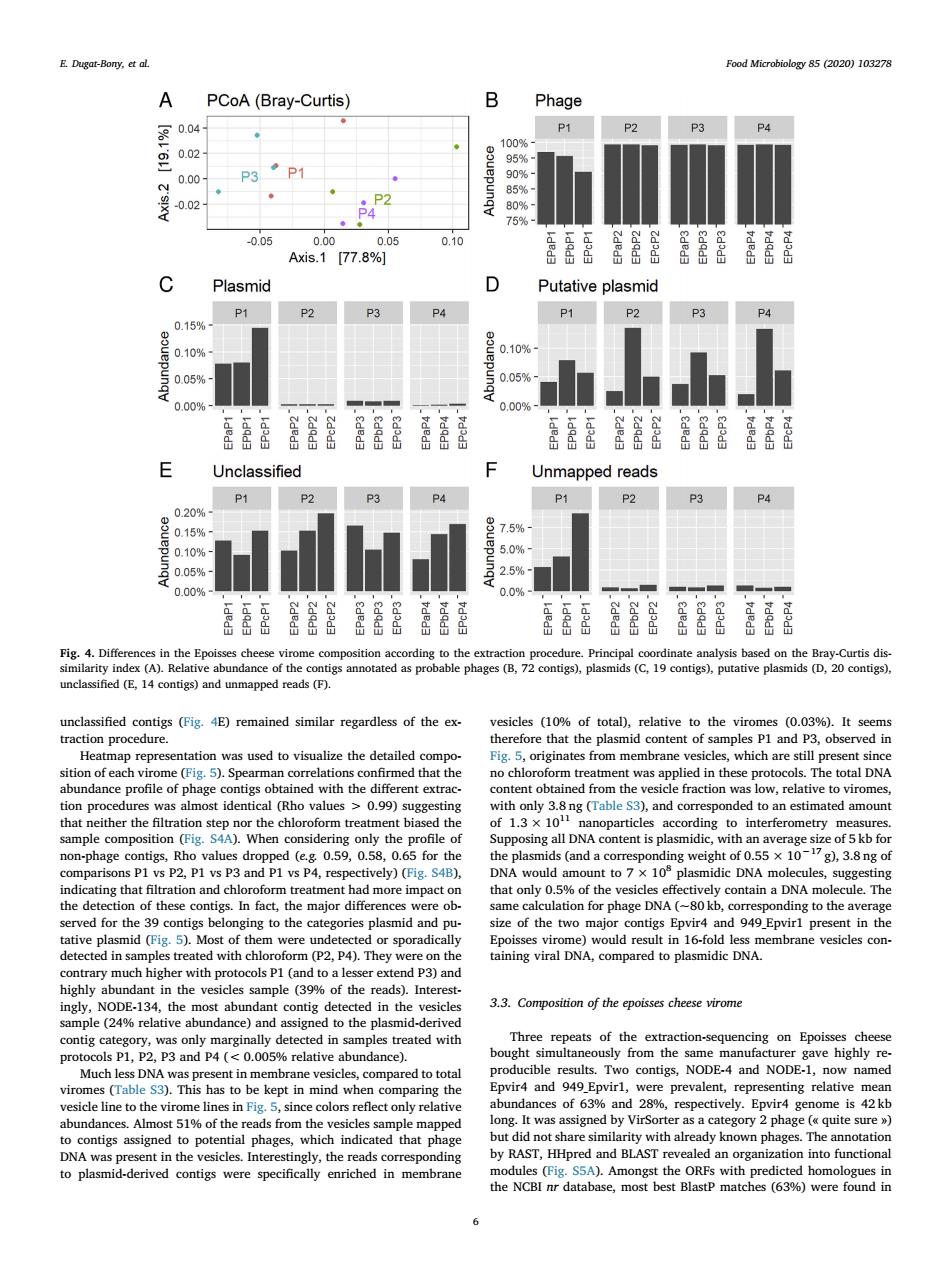
E.Dugat-Bony,ct al. A PCoA(Bray-Curtis) B P1 P2 P3·P1 9 0.05 0.00 005 0.10 Axis.1【77.8% 著吾吾影暑昌是 Plasmid 0 Putative plasmid P2 P3 P4 P1 P3 0.15% 0.10 2010g 50.05% 0.05% 00% 是笔笔器昌影昆昌是 吾嘉吾駕器影昌嚣昆是是居 E Unclassified Unmapped reads P1 P2 P3 P4 P1 P2 P3 P4 75% 80.10%- 5.0% 60.05% 825% .00 臣露能器鴛昌是景昌是昌 臣香鉴器影是器器是是 (4E)remained similar regardless of the x repre ation was used to visualize the detailed com ig originates from m mbrane les.which are still prese he DN obt ined from t 13 (Table amou r the chl。 d the mid wer ne c plasmid (Mot ore on the dic in16-fod embrane vesicles con- 3.3.Composition of the epoisses cheese virome to the plas ext ction-s quencing on poi NODE-4 and NODE-1 now viron es ().This has to be kept in mind when comparing the vird and e prevalent,repr by Virs egory phage (quite sure) rganizatio into functiona to plasmid-derived contigs were specifically enriched in membrane he(%)were found in unclassified contigs (Fig. 4E) remained similar regardless of the extraction procedure. Heatmap representation was used to visualize the detailed composition of each virome (Fig. 5). Spearman correlations confirmed that the abundance profile of phage contigs obtained with the different extraction procedures was almost identical (Rho values > 0.99) suggesting that neither the filtration step nor the chloroform treatment biased the sample composition (Fig. S4A). When considering only the profile of non-phage contigs, Rho values dropped (e.g. 0.59, 0.58, 0.65 for the comparisons P1 vs P2, P1 vs P3 and P1 vs P4, respectively) (Fig. S4B), indicating that filtration and chloroform treatment had more impact on the detection of these contigs. In fact, the major differences were observed for the 39 contigs belonging to the categories plasmid and putative plasmid (Fig. 5). Most of them were undetected or sporadically detected in samples treated with chloroform (P2, P4). They were on the contrary much higher with protocols P1 (and to a lesser extend P3) and highly abundant in the vesicles sample (39% of the reads). Interestingly, NODE-134, the most abundant contig detected in the vesicles sample (24% relative abundance) and assigned to the plasmid-derived contig category, was only marginally detected in samples treated with protocols P1, P2, P3 and P4 (< 0.005% relative abundance). Much less DNA was present in membrane vesicles, compared to total viromes (Table S3). This has to be kept in mind when comparing the vesicle line to the virome lines in Fig. 5, since colors reflect only relative abundances. Almost 51% of the reads from the vesicles sample mapped to contigs assigned to potential phages, which indicated that phage DNA was present in the vesicles. Interestingly, the reads corresponding to plasmid-derived contigs were specifically enriched in membrane vesicles (10% of total), relative to the viromes (0.03%). It seems therefore that the plasmid content of samples P1 and P3, observed in Fig. 5, originates from membrane vesicles, which are still present since no chloroform treatment was applied in these protocols. The total DNA content obtained from the vesicle fraction was low, relative to viromes, with only 3.8 ng (Table S3), and corresponded to an estimated amount of 1.3 × 10¹¹ nanoparticles according to interferometry measures. Supposing all DNA content is plasmidic, with an average size of 5 kb for the plasmids (and a corresponding weight of 0.55 × 10⁻¹⁷ g), 3.8 ng of DNA would amount to 7 × 10⁸ plasmidic DNA molecules, suggesting that only 0.5% of the vesicles effectively contain a DNA molecule. The same calculation for phage DNA (~80 kb, corresponding to the average size of the two major contigs Epvir4 and 949_Epvir1 present in the Epoisses virome) would result in 16-fold less membrane vesicles containing viral DNA, compared to plasmidic DNA. 3.3. Composition of the epoisses cheese virome Three repeats of the extraction-sequencing on Epoisses cheese bought simultaneously from the same manufacturer gave highly reproducible results. Two contigs, NODE-4 and NODE-1, now named Epvir4 and 949_Epvir1, were prevalent, representing relative mean abundances of 63% and 28%, respectively. Epvir4 genome is 42 kb long. It was assigned by VirSorter as a category 2 phage (« quite sure ») but did not share similarity with already known phages. The annotation by RAST, HHpred and BLAST revealed an organization into functional modules (Fig. S5A). Amongst the ORFs with predicted homologues in the NCBI nr database, most best BlastP matches (63%) were found in Fig. 4. Differences in the Epoisses cheese virome composition according to the extraction procedure. Principal coordinate analysis based on the Bray-Curtis dissimilarity index (A). Relative abundance of the contigs annotated as probable phages (B, 72 contigs), plasmids (C, 19 contigs), putative plasmids (D, 20 contigs), unclassified (E, 14 contigs) and unmapped reads (F). E. Dugat-Bony, et al. Food Microbiology 85 (2020) 103278 6