正在加载图片...
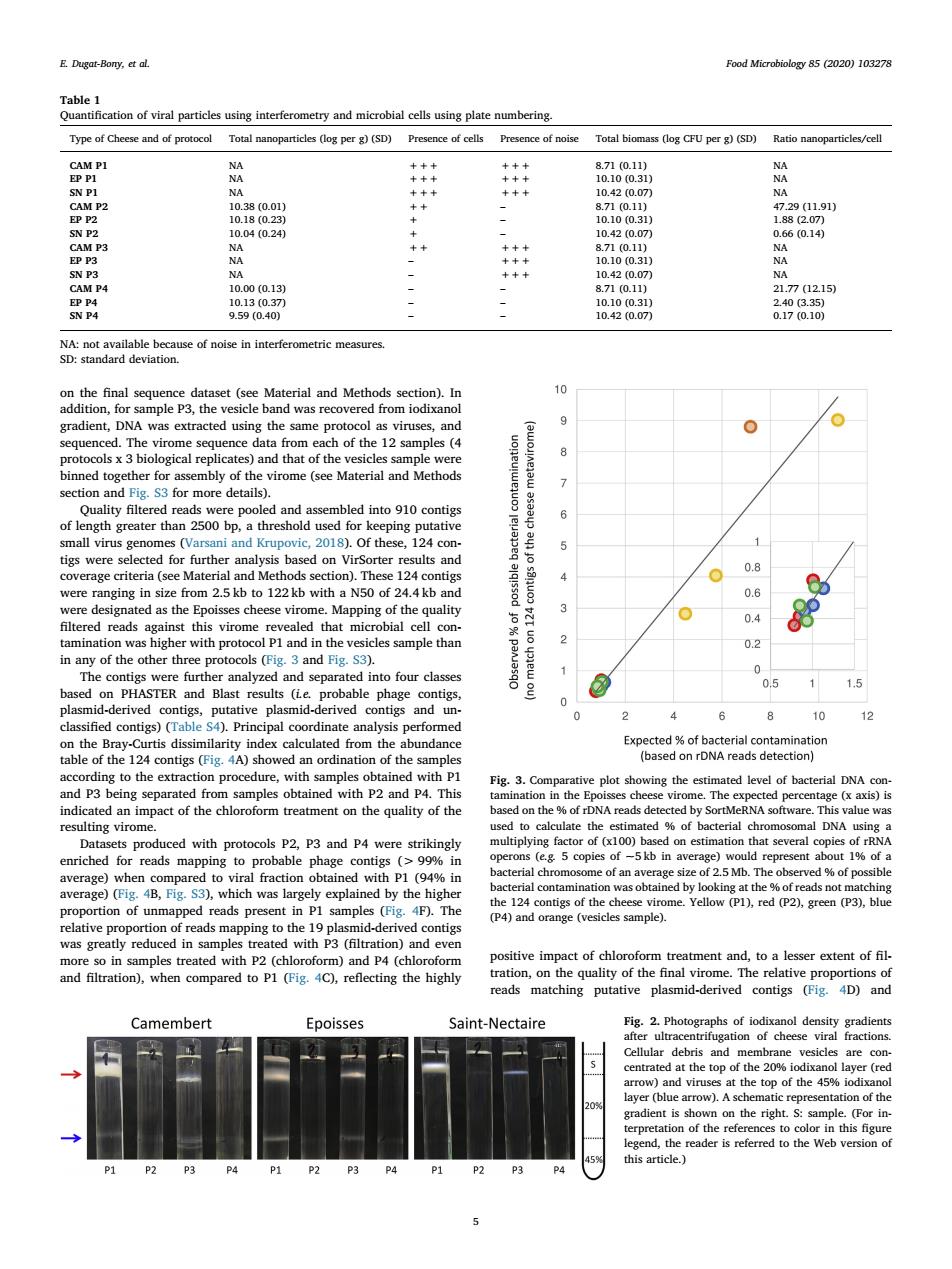
E.Dgat-Bany,ctal Food Microbiology 85 (2020)103278 Type of Cheese and of protocol Total n ticles (log per g)(SD)Presence of cells Presence of noise Total bomas (o CFU per(5D)Ratio nanoparticles/cell 10.10 (03 7 i0100.3 se of noise in interferometric mea ade cof the 12 amples section and Fig.S3 for more details) into 910c of for eping 12 tigs were orter 08 were ranging in size from 2.5 kb to 122 kb with a N50 of 24.4 kb and 0.6 3 04 cles sample thar 2 0.2 0 hidldeivedcontig putative contigs and 0 10 1 calculate from the an mp ng vi ed with p cols P2. P3 and P4 hed fo of 25Mb of e)(is Yellow (P1).red (2).re(P)b ing to P4) the 1 y red ed with impact of chloro form treatment and,to a lesser extent of fil and filtration).when compared to Pl(Fig.4C).reflecting the highly eads matching putative plasmid-derived contigs(iD)and Camembert Epoisses Saint-Nectaire Fig.2.of top the 20%6 iod w) prese tatio of th this articleon the final sequence dataset (see Material and Methods section). In addition, for sample P3, the vesicle band was recovered from iodixanol gradient, DNA was extracted using the same protocol as viruses, and sequenced. The virome sequence data from each of the 12 samples (4 protocols x 3 biological replicates) and that of the vesicles sample were binned together for assembly of the virome (see Material and Methods section and Fig. S3 for more details). Quality filtered reads were pooled and assembled into 910 contigs of length greater than 2500 bp, a threshold used for keeping putative small virus genomes (Varsani and Krupovic, 2018). Of these, 124 contigs were selected for further analysis based on VirSorter results and coverage criteria (see Material and Methods section). These 124 contigs were ranging in size from 2.5 kb to 122 kb with a N50 of 24.4 kb and were designated as the Epoisses cheese virome. Mapping of the quality filtered reads against this virome revealed that microbial cell contamination was higher with protocol P1 and in the vesicles sample than in any of the other three protocols (Fig. 3 and Fig. S3). The contigs were further analyzed and separated into four classes based on PHASTER and Blast results (i.e. probable phage contigs, plasmid-derived contigs, putative plasmid-derived contigs and unclassified contigs) (Table S4). Principal coordinate analysis performed on the Bray-Curtis dissimilarity index calculated from the abundance table of the 124 contigs (Fig. 4A) showed an ordination of the samples according to the extraction procedure, with samples obtained with P1 and P3 being separated from samples obtained with P2 and P4. This indicated an impact of the chloroform treatment on the quality of the resulting virome. Datasets produced with protocols P2, P3 and P4 were strikingly enriched for reads mapping to probable phage contigs (> 99% in average) when compared to viral fraction obtained with P1 (94% in average) (Fig. 4B, Fig. S3), which was largely explained by the higher proportion of unmapped reads present in P1 samples (Fig. 4F). The relative proportion of reads mapping to the 19 plasmid-derived contigs was greatly reduced in samples treated with P3 (filtration) and even more so in samples treated with P2 (chloroform) and P4 (chloroform and filtration), when compared to P1 (Fig. 4C), reflecting the highly positive impact of chloroform treatment and, to a lesser extent of filtration, on the quality of the final virome. The relative proportions of reads matching putative plasmid-derived contigs (Fig. 4D) and Table 1 Quantification of viral particles using interferometry and microbial cells using plate numbering. Type of Cheese and of protocol Total nanoparticles (log per g) (SD) Presence of cells Presence of noise Total biomass (log CFU per g) (SD) Ratio nanoparticles/cell CAM P1 NA +++ +++ 8.71 (0.11) NA EP P1 NA +++ +++ 10.10 (0.31) NA SN P1 NA +++ +++ 10.42 (0.07) NA CAM P2 10.38 (0.01) ++ – 8.71 (0.11) 47.29 (11.91) EP P2 10.18 (0.23) + – 10.10 (0.31) 1.88 (2.07) SN P2 10.04 (0.24) + – 10.42 (0.07) 0.66 (0.14) CAM P3 NA ++ +++ 8.71 (0.11) NA EP P3 NA – +++ 10.10 (0.31) NA SN P3 NA – +++ 10.42 (0.07) NA CAM P4 10.00 (0.13) – – 8.71 (0.11) 21.77 (12.15) EP P4 10.13 (0.37) – – 10.10 (0.31) 2.40 (3.35) SN P4 9.59 (0.40) – – 10.42 (0.07) 0.17 (0.10) NA: not available because of noise in interferometric measures. SD: standard deviation. Fig. 2. Photographs of iodixanol density gradients after ultracentrifugation of cheese viral fractions. Cellular debris and membrane vesicles are concentrated at the top of the 20% iodixanol layer (red arrow) and viruses at the top of the 45% iodixanol layer (blue arrow). A schematic representation of the gradient is shown on the right. S: sample. (For interpretation of the references to color in this figure legend, the reader is referred to the Web version of this article.) Fig. 3. Comparative plot showing the estimated level of bacterial DNA contamination in the Epoisses cheese virome. The expected percentage (x axis) is based on the % of rDNA reads detected by SortMeRNA software. This value was used to calculate the estimated % of bacterial chromosomal DNA using a multiplying factor of (x100) based on estimation that several copies of rRNA operons (e.g. 5 copies of ~5 kb in average) would represent about 1% of a bacterial chromosome of an average size of 2.5 Mb. The observed % of possible bacterial contamination was obtained by looking at the % of reads not matching the 124 contigs of the cheese virome. Yellow (P1), red (P2), green (P3), blue (P4) and orange (vesicles sample). E. Dugat-Bony, et al. Food Microbiology 85 (2020) 103278 5