正在加载图片...
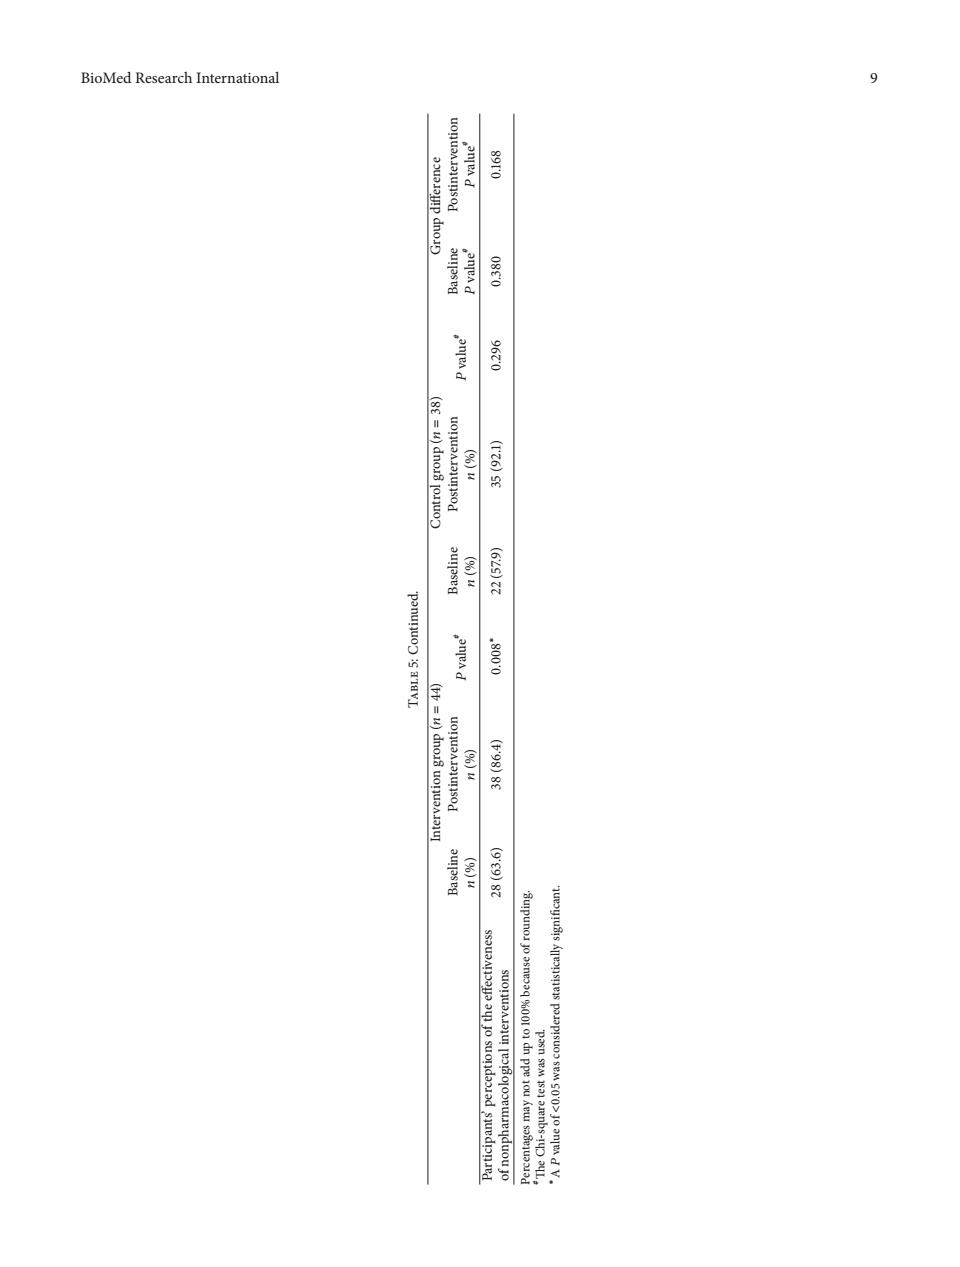
BioMed Research International 9 auaaup dno5 onjead 道美 2800 neAd 0620 (126)59 (620)02 ane入 ·v00.0 (=u)dno uonuaAJuI (4.08).80 (993 upuno jo asnaq%o dn ppe ou w sau pasn seM isa1 aenbs-1yD ayLBioMed Research International 9 Table 5: Continued. Intervention group (𝑛 = 44) Control group (𝑛 = 38) Group difference Baseline Postintervention 𝑃 value# Baseline Postintervention 𝑃 value# Baseline Postintervention 𝑛 (%) 𝑛 (%) 𝑛 (%) 𝑛 (%) 𝑃 value# 𝑃 value# Participants’ perceptions of the effectiveness of nonpharmacological interventions 28 (63.6) 38 (86.4) 0.008∗ 22 (57.9) 35 (92.1) 0.296 0.380 0.168 Percentages may not add up to 100% because of rounding. #The Chi-square test was used. ∗A 𝑃 value of <0.05 was considered statistically significant