正在加载图片...
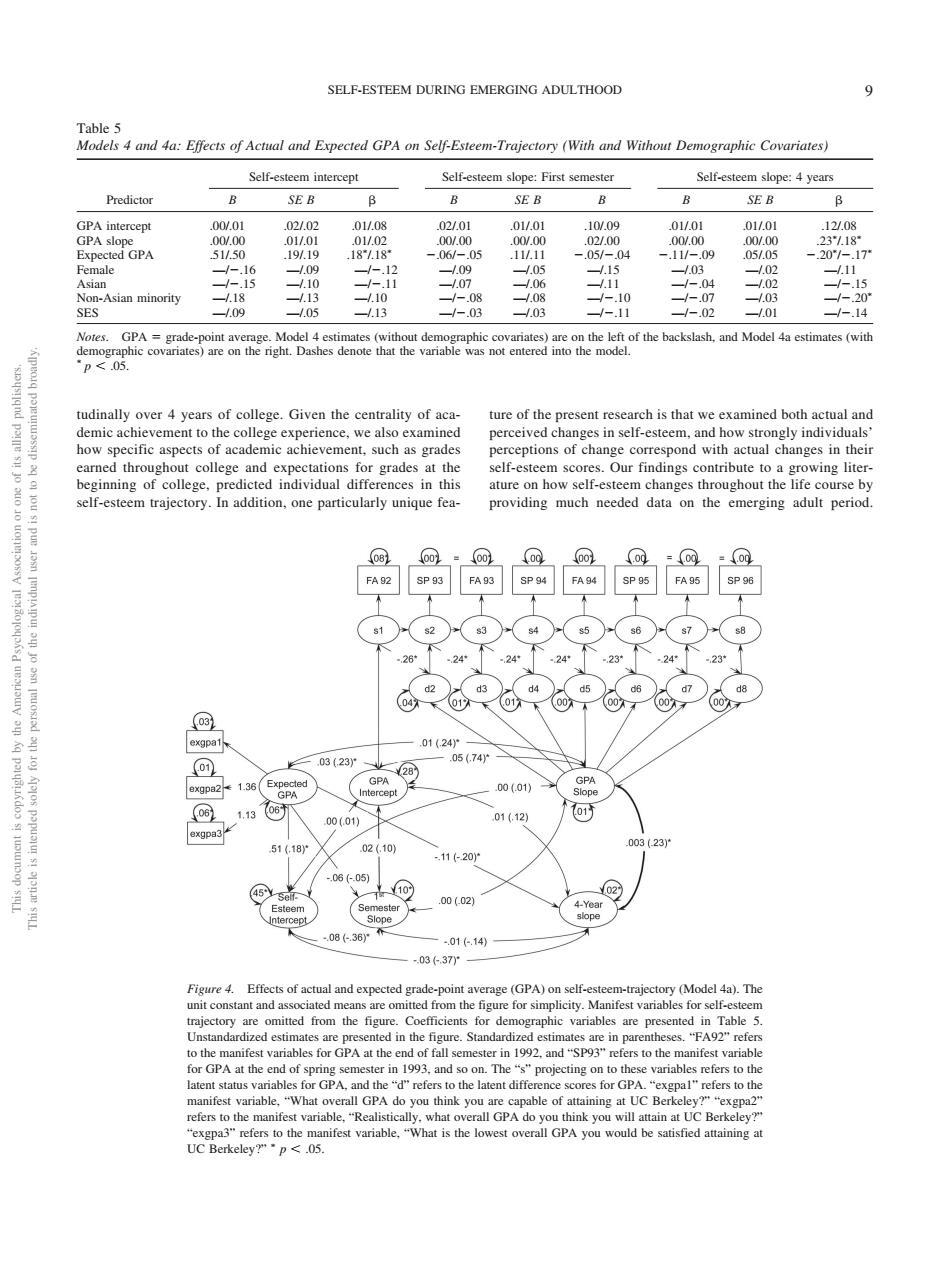
SELF-ESTEEM DURING EMERGING ADULTHOOD Self-estem Self-esteem slo ope:4 year Predictor SE B SE B SE B 00.01 02/.02 2/01 1/.0 Asian minority SES 爱的心山 udinally over 4 years of college.Given the centrality of aca ture of the present is that oh e ceptions of change correspond with actual changes in thei ature on how self-esteemchane throughout the life course self-esteem trajectory.In addition,one particularly unique fea providing much needed data on the emerging adult period 261 24 24201个23201 .01(24 03(23y 05(74 0001) 01(12) 51.180 02(.10 1120 00(02) 04-37 (GPA (Model 4a).Th 17992. ers to the for GP youtudinally over 4 years of college. Given the centrality of academic achievement to the college experience, we also examined how specific aspects of academic achievement, such as grades earned throughout college and expectations for grades at the beginning of college, predicted individual differences in this self-esteem trajectory. In addition, one particularly unique feature of the present research is that we examined both actual and perceived changes in self-esteem, and how strongly individuals’ perceptions of change correspond with actual changes in their self-esteem scores. Our findings contribute to a growing literature on how self-esteem changes throughout the life course by providing much needed data on the emerging adult period. Table 5 Models 4 and 4a: Effects of Actual and Expected GPA on Self-Esteem-Trajectory (With and Without Demographic Covariates) Predictor Self-esteem intercept Self-esteem slope: First semester Self-esteem slope: 4 years B SE B B SE B B B SE B GPA intercept .00/.01 .02/.02 .01/.08 .02/.01 .01/.01 .10/.09 .01/.01 .01/.01 .12/.08 GPA slope .00/.00 .01/.01 .01/.02 .00/.00 .00/.00 .02/.00 .00/.00 .00/.00 .23 /.18 Expected GPA .51/.50 .19/.19 .18 /.18 .06/.05 .11/.11 .05/.04 .11/.09 .05/.05 .20 /.17 Female —/.16 —/.09 —/.12 —/.09 —/.05 —/.15 —/.03 —/.02 —/.11 Asian —/.15 —/.10 —/.11 —/.07 —/.06 —/.11 —/.04 —/.02 —/.15 Non-Asian minority —/.18 —/.13 —/.10 —/.08 —/.08 —/.10 —/.07 —/.03 —/.20 SES —/.09 —/.05 —/.13 —/.03 —/.03 —/.11 —/.02 —/.01 —/.14 Notes. GPA grade-point average. Model 4 estimates (without demographic covariates) are on the left of the backslash, and Model 4a estimates (with demographic covariates) are on the right. Dashes denote that the variable was not entered into the model. p .05. Figure 4. Effects of actual and expected grade-point average (GPA) on self-esteem-trajectory (Model 4a). The unit constant and associated means are omitted from the figure for simplicity. Manifest variables for self-esteem trajectory are omitted from the figure. Coefficients for demographic variables are presented in Table 5. Unstandardized estimates are presented in the figure. Standardized estimates are in parentheses. “FA92” refers to the manifest variables for GPA at the end of fall semester in 1992, and “SP93” refers to the manifest variable for GPA at the end of spring semester in 1993, and so on. The “s” projecting on to these variables refers to the latent status variables for GPA, and the “d” refers to the latent difference scores for GPA. “exgpa1” refers to the manifest variable, “What overall GPA do you think you are capable of attaining at UC Berkeley?” “exgpa2” refers to the manifest variable, “Realistically, what overall GPA do you think you will attain at UC Berkeley?” “exgpa3” refers to the manifest variable, “What is the lowest overall GPA you would be satisfied attaining at UC Berkeley?” p .05. This document is copyrighted by the American Psychological Association or one of its allied publishers. This article is intended solely for the personal use of the individual user and is not to be disseminated broadly. SELF-ESTEEM DURING EMERGING ADULTHOOD 9������������������������