正在加载图片...
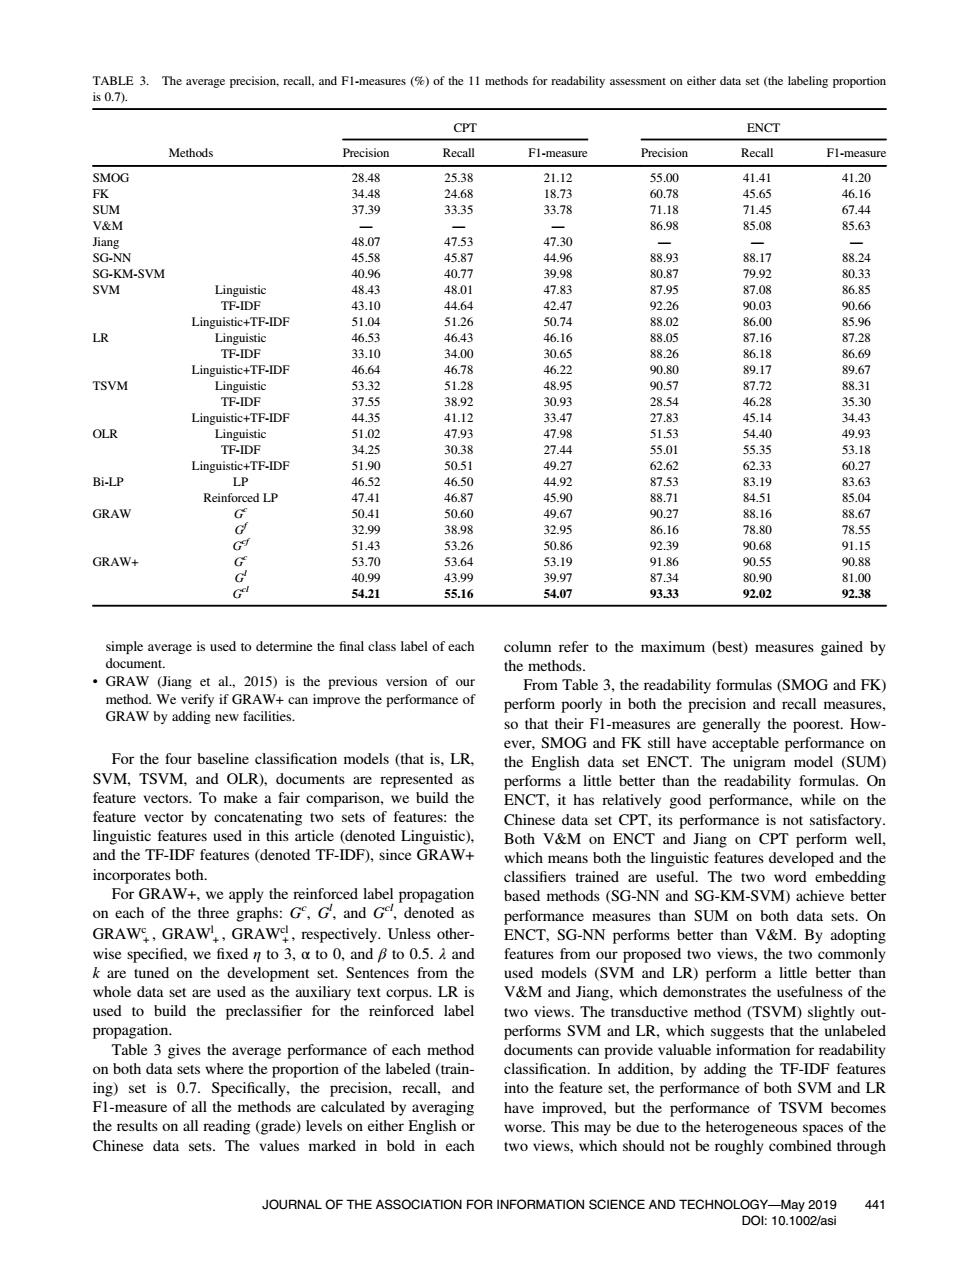
TABLE 3.The average precision,recall,and Fl-measures (%of the 11 methods for readability assessment on either data set (the labeling proportion is0.7). CPT ENCT Methods Precision Recall F1-measure Precision Recall Fl-measure SMOG 28.48 25.38 21.12 55.00 41.41 41.20 FK 34.48 24.68 18.73 60.78 45.65 46.16 SUM 37.39 33.35 33.78 71.18 71.45 67.44 V&M 86.98 85.08 85.63 Jiang 48.07 47.53 47.30 SG-NN 45.58 45.87 44.96 88.93 88.17 88.24 SG-KM-SVM 40.96 40.77 39.98 80.87 79.92 80.33 SVM Linguistic 48.43 48.01 47.83 87.95 87.08 86.85 TF-IDF 43.10 44.64 42.47 92.26 90.03 90.66 Linguistic+TF-IDF 51.04 51.26 50.74 88.02 86.00 85.96 LR Linguistic 46.53 46.43 46.16 88.05 87.16 87.28 TF-IDF 33.10 34.00 30.65 88.26 86.18 86.69 Linguistic+TF-IDF 46.64 46.78 46.22 90.80 89.17 89.67 TSVM Linguistic 53.32 51.28 48.95 90.57 87.72 88.31 TF-IDF 37.55 38.92 30.93 28.54 46.28 35.30 Linguistic+TF-IDF 44.35 41.12 33.47 27.83 45.14 34.43 OLR Linguistic 51.02 47.93 47.98 51.53 54.40 49.93 TF-IDF 34.25 30.38 27.44 55.01 55.35 53.18 Linguistic+TF-IDF 51.90 50.51 49.27 62.62 62.33 60.27 Bi-LP LP 46.52 46.50 44.92 87.53 83.19 83.63 Reinforced LP 47.41 46.87 45.90 88.71 84.51 85.04 GRAW G 50.41 50.60 49.67 90.27 88.16 88.67 32.99 38.98 32.95 86.16 78.80 78.55 G9 51.43 53.26 50.86 92.39 90.68 91.15 GRAW+ G 53.70 53.64 53.19 91.86 90.55 90.88 40.99 43.99 39.97 87.34 80.90 81.00 G 54.21 55.16 54.07 93.33 92.02 92.38 simple average is used to determine the final class label of each column refer to the maximum (best)measures gained by document. the methods. GRAW (Jiang et al.,2015)is the previous version of our From Table 3.the readability formulas (SMOG and FK) method.We verify if GRAW+can improve the performance of perform poorly in both the precision and recall measures, GRAW by adding new facilities. so that their F1-measures are generally the poorest.How- ever,SMOG and FK still have acceptable performance on For the four baseline classification models (that is.LR. the English data set ENCT.The unigram model (SUM) SVM,TSVM,and OLR),documents are represented as performs a little better than the readability formulas.On feature vectors.To make a fair comparison,we build the ENCT,it has relatively good performance,while on the feature vector by concatenating two sets of features:the Chinese data set CPT,its performance is not satisfactory. linguistic features used in this article (denoted Linguistic). Both V&M on ENCT and Jiang on CPT perform well, and the TF-IDF features (denoted TF-IDF).since GRAW+ which means both the linguistic features developed and the incorporates both. classifiers trained are useful.The two word embedding For GRAW+,we apply the reinforced label propagation based methods (SG-NN and SG-KM-SVM)achieve better on each of the three graphs:G,G,and Ge,denoted as performance measures than SUM on both data sets.On GRAW,GRAW,GRAW!,respectively.Unless other- ENCT,SG-NN performs better than V&M.By adopting wise specified,we fixed n to 3,a to 0,and B to 0.5.and features from our proposed two views,the two commonly k are tuned on the development set.Sentences from the used models (SVM and LR)perform a little better than whole data set are used as the auxiliary text corpus.LR is V&M and Jiang,which demonstrates the usefulness of the used to build the preclassifier for the reinforced label two views.The transductive method (TSVM)slightly out- propagation. performs SVM and LR,which suggests that the unlabeled Table 3 gives the average performance of each method documents can provide valuable information for readability on both data sets where the proportion of the labeled(train- classification.In addition,by adding the TF-IDF features ing)set is 0.7.Specifically,the precision,recall,and into the feature set,the performance of both SVM and LR Fl-measure of all the methods are calculated by averaging have improved,but the performance of TSVM becomes the results on all reading(grade)levels on either English or worse.This may be due to the heterogeneous spaces of the Chinese data sets.The values marked in bold in each two views,which should not be roughly combined through JOURNAL OF THE ASSOCIATION FOR INFORMATION SCIENCE AND TECHNOLOGY-May 2019 441 D0:10.1002/asisimple average is used to determine the final class label of each document. • GRAW (Jiang et al., 2015) is the previous version of our method. We verify if GRAW+ can improve the performance of GRAW by adding new facilities. For the four baseline classification models (that is, LR, SVM, TSVM, and OLR), documents are represented as feature vectors. To make a fair comparison, we build the feature vector by concatenating two sets of features: the linguistic features used in this article (denoted Linguistic), and the TF-IDF features (denoted TF-IDF), since GRAW+ incorporates both. For GRAW+, we apply the reinforced label propagation on each of the three graphs: Gc , Gl , and Gcl, denoted as GRAWc + , GRAWl + , GRAWcl + , respectively. Unless otherwise specified, we fixed η to 3, α to 0, and β to 0.5. λ and k are tuned on the development set. Sentences from the whole data set are used as the auxiliary text corpus. LR is used to build the preclassifier for the reinforced label propagation. Table 3 gives the average performance of each method on both data sets where the proportion of the labeled (training) set is 0.7. Specifically, the precision, recall, and F1-measure of all the methods are calculated by averaging the results on all reading (grade) levels on either English or Chinese data sets. The values marked in bold in each column refer to the maximum (best) measures gained by the methods. From Table 3, the readability formulas (SMOG and FK) perform poorly in both the precision and recall measures, so that their F1-measures are generally the poorest. However, SMOG and FK still have acceptable performance on the English data set ENCT. The unigram model (SUM) performs a little better than the readability formulas. On ENCT, it has relatively good performance, while on the Chinese data set CPT, its performance is not satisfactory. Both V&M on ENCT and Jiang on CPT perform well, which means both the linguistic features developed and the classifiers trained are useful. The two word embedding based methods (SG-NN and SG-KM-SVM) achieve better performance measures than SUM on both data sets. On ENCT, SG-NN performs better than V&M. By adopting features from our proposed two views, the two commonly used models (SVM and LR) perform a little better than V&M and Jiang, which demonstrates the usefulness of the two views. The transductive method (TSVM) slightly outperforms SVM and LR, which suggests that the unlabeled documents can provide valuable information for readability classification. In addition, by adding the TF-IDF features into the feature set, the performance of both SVM and LR have improved, but the performance of TSVM becomes worse. This may be due to the heterogeneous spaces of the two views, which should not be roughly combined through TABLE 3. The average precision, recall, and F1-measures (%) of the 11 methods for readability assessment on either data set (the labeling proportion is 0.7). Methods CPT ENCT Precision Recall F1-measure Precision Recall F1-measure SMOG 28.48 25.38 21.12 55.00 41.41 41.20 FK 34.48 24.68 18.73 60.78 45.65 46.16 SUM 37.39 33.35 33.78 71.18 71.45 67.44 V&M —— — 86.98 85.08 85.63 Jiang 48.07 47.53 47.30 —— — SG-NN 45.58 45.87 44.96 88.93 88.17 88.24 SG-KM-SVM 40.96 40.77 39.98 80.87 79.92 80.33 SVM Linguistic 48.43 48.01 47.83 87.95 87.08 86.85 TF-IDF 43.10 44.64 42.47 92.26 90.03 90.66 Linguistic+TF-IDF 51.04 51.26 50.74 88.02 86.00 85.96 LR Linguistic 46.53 46.43 46.16 88.05 87.16 87.28 TF-IDF 33.10 34.00 30.65 88.26 86.18 86.69 Linguistic+TF-IDF 46.64 46.78 46.22 90.80 89.17 89.67 TSVM Linguistic 53.32 51.28 48.95 90.57 87.72 88.31 TF-IDF 37.55 38.92 30.93 28.54 46.28 35.30 Linguistic+TF-IDF 44.35 41.12 33.47 27.83 45.14 34.43 OLR Linguistic 51.02 47.93 47.98 51.53 54.40 49.93 TF-IDF 34.25 30.38 27.44 55.01 55.35 53.18 Linguistic+TF-IDF 51.90 50.51 49.27 62.62 62.33 60.27 Bi-LP LP 46.52 46.50 44.92 87.53 83.19 83.63 Reinforced LP 47.41 46.87 45.90 88.71 84.51 85.04 GRAW Gc 50.41 50.60 49.67 90.27 88.16 88.67 Gf 32.99 38.98 32.95 86.16 78.80 78.55 Gcf 51.43 53.26 50.86 92.39 90.68 91.15 GRAW+ Gc 53.70 53.64 53.19 91.86 90.55 90.88 Gl 40.99 43.99 39.97 87.34 80.90 81.00 Gcl 54.21 55.16 54.07 93.33 92.02 92.38 JOURNAL OF THE ASSOCIATION FOR INFORMATION SCIENCE AND TECHNOLOGY—May 2019 DOI: 10.1002/asi 441