正在加载图片...
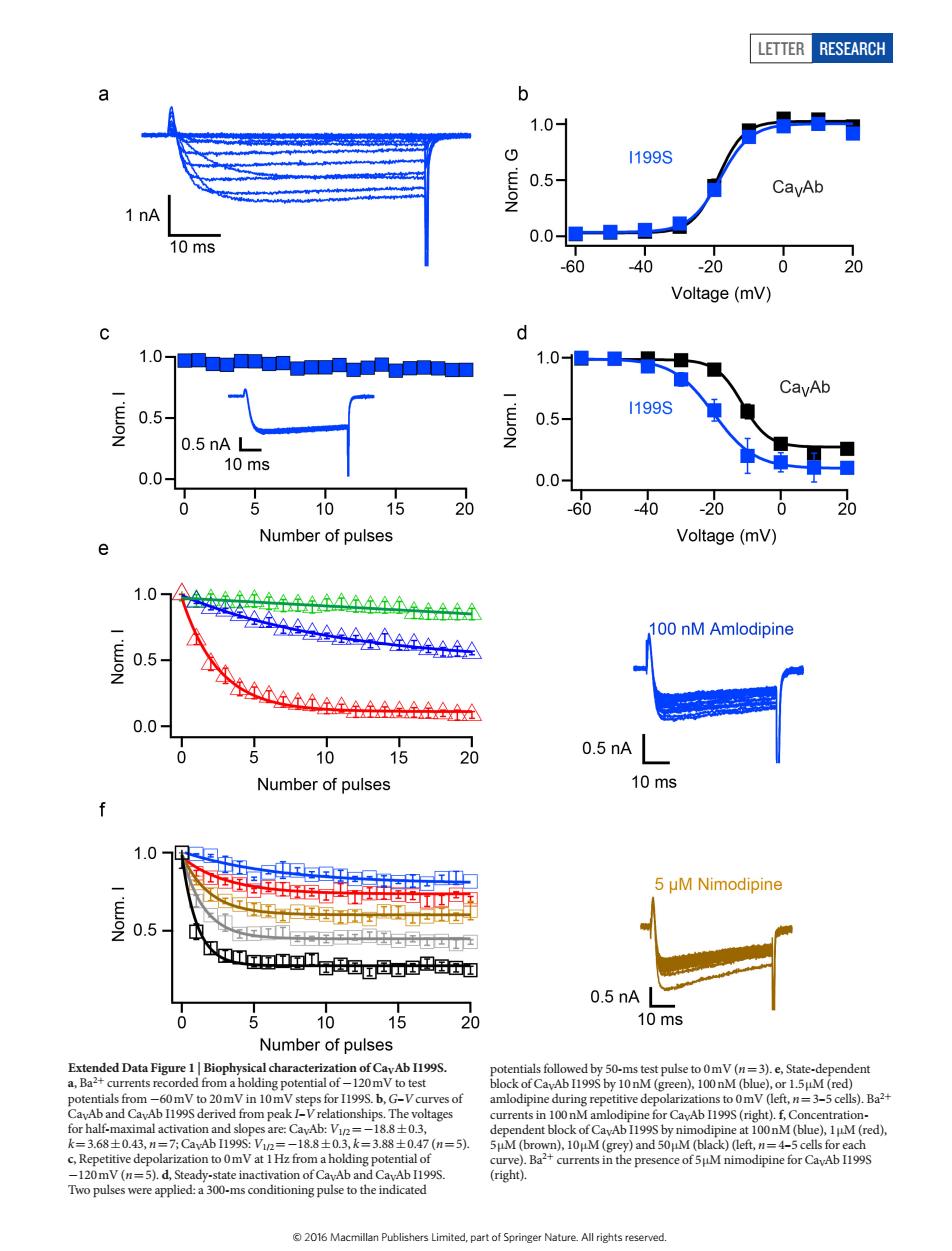
LETTER RESEARCH b 1.0 0.5- CayAb 10 ms 0.0- -6040-20 0 Voltage(mV) d .0 1.0 CavAb 0.5 0.5 199s 0.5 nA L 0.0- 10ms 0.0 0 5 1015 20 60 4020 20 Number of pulses Voltage(mV) e 1.0 100 nM Amlodipine 5 0.0 S全4的 10 0.5nA| Number of pulses 10 ms 1.0 5 uM Nimodipine 0.5 0.5nA 10 15 10ms Number of pulses dData Figure 1 Bio s).Ba2 Ab ar Ab I199 r CavAb 1199(ri ht)f.( (blue),M(red =7C (rightLetter RESEARCH Extended Data Figure 1 | Biophysical characterization of CaVAb I199S. a, Ba2+ currents recorded from a holding potential of −120mV to test potentials from −60mV to 20mV in 10mV steps for I199S. b, G–V curves of CaVAb and CaVAb I199S derived from peak I–V relationships. The voltages for half-maximal activation and slopes are: CaVAb: V1/2=−18.8±0.3, k=3.68±0.43, n=7; CaVAb I199S: V1/2=−18.8±0.3, k=3.88±0.47 (n=5). c, Repetitive depolarization to 0mV at 1Hz from a holding potential of −120mV (n=5). d, Steady-state inactivation of CaVAb and CaVAb I199S. Two pulses were applied: a 300-ms conditioning pulse to the indicated potentials followed by 50-ms test pulse to 0mV (n=3). e, State-dependent block of CaVAb I199S by 10nM (green), 100nM (blue), or 1.5μM (red) amlodipine during repetitive depolarizations to 0mV (left, n=3–5 cells). Ba2+ currents in 100nM amlodipine for CaVAb I199S (right). f, Concentrationdependent block of CaVAb I199S by nimodipine at 100nM (blue), 1μM (red), 5μM (brown), 10μM (grey) and 50μM (black) (left, n=4–5 cells for each curve). Ba2+ currents in the presence of 5μM nimodipine for CaVAb I199S (right). © 2016 Macmillan Publishers Limited, part of Springer Nature. All rights reserved