正在加载图片...
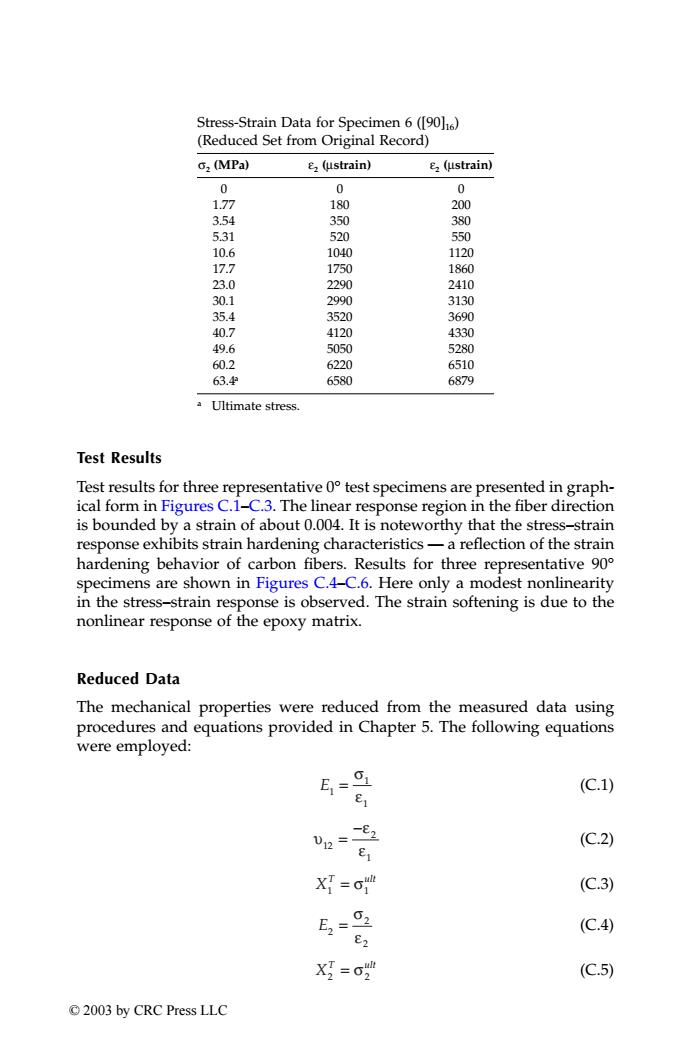
Stress-Strain Data for Specimen 6([90]16) (Reduced Set from Original Record) G2 (MPa) E2(ustrain) 2(ustrain) 0 0 1.77 180 200 3.54 350 380 5.31 520 550 10.6 1040 1120 17.7 1750 1860 23.0 2290 2410 30.1 2990 3130 35.4 3520 3690 40.7 4120 4330 49.6 5050 5280 60.2 6220 6510 63. 6580 6879 Ultimate stress. Test Results Test results for three representative 0 test specimens are presented in graph- ical form in Figures C.1-C.3.The linear response region in the fiber direction is bounded by a strain of about 0.004.It is noteworthy that the stress-strain response exhibits strain hardening characteristics-a reflection of the strain hardening behavior of carbon fibers.Results for three representative 900 specimens are shown in Figures C.4-C.6.Here only a modest nonlinearity in the stress-strain response is observed.The strain softening is due to the nonlinear response of the epoxy matrix. Reduced Data The mechanical properties were reduced from the measured data using procedures and equations provided in Chapter 5.The following equations were employed: (C.1) E1 2s (C.2) E XT=G (C.3) 59 (C.4) E2 X=o2 (C.5) ©2003 by CRC Press LLCTest Results Test results for three representative 0° test specimens are presented in graphical form in Figures C.1–C.3. The linear response region in the fiber direction is bounded by a strain of about 0.004. It is noteworthy that the stress–strain response exhibits strain hardening characteristics — a reflection of the strain hardening behavior of carbon fibers. Results for three representative 90° specimens are shown in Figures C.4–C.6. Here only a modest nonlinearity in the stress–strain response is observed. The strain softening is due to the nonlinear response of the epoxy matrix. Reduced Data The mechanical properties were reduced from the measured data using procedures and equations provided in Chapter 5. The following equations were employed: (C.1) (C.2) (C.3) (C.4) (C.5) Stress-Strain Data for Specimen 6 ([90]16) (Reduced Set from Original Record) σ2 (MPa) ε2 (µstrain) ε2 (µstrain) 00 0 1.77 180 200 3.54 350 380 5.31 520 550 10.6 1040 1120 17.7 1750 1860 23.0 2290 2410 30.1 2990 3130 35.4 3520 3690 40.7 4120 4330 49.6 5050 5280 60.2 6220 6510 63.4a 6580 6879 a Ultimate stress. E1 1 1 = σ ε υ ε ε 12 2 1 = − XT ult 1 1 = σ E2 2 2 = σ ε XT ult 2 2 = σ TX001_AppC_Frame Page 229 Saturday, September 21, 2002 5:14 AM © 2003 by CRC Press LLC