正在加载图片...

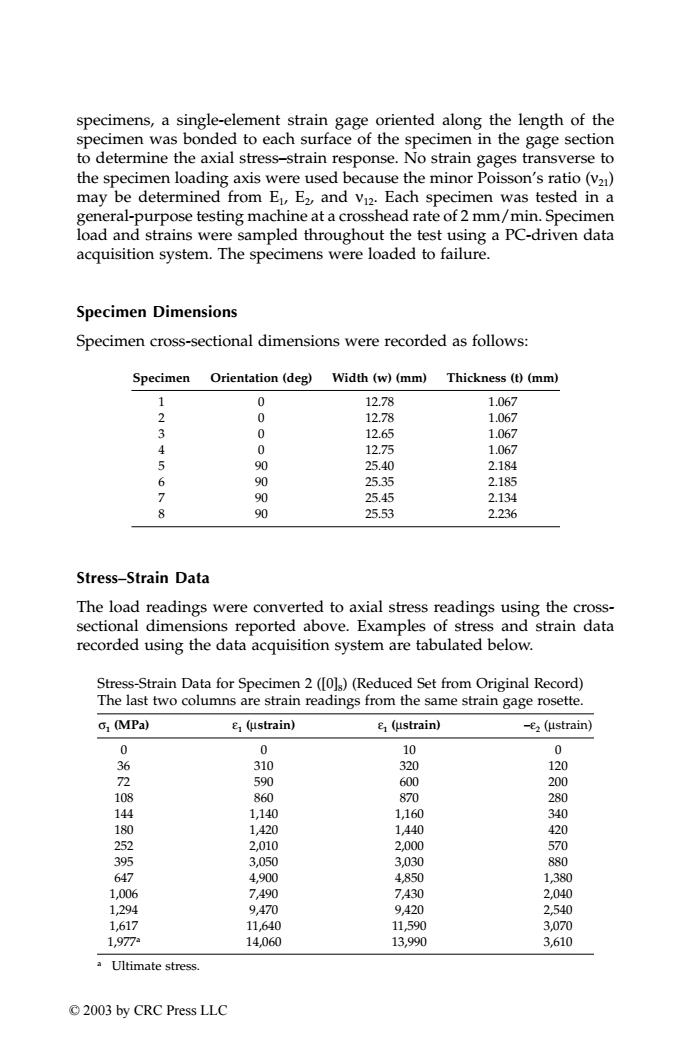
specimens,a single-element strain gage oriented along the length of the specimen was bonded to each surface of the specimen in the gage section to determine the axial stress-strain response.No strain gages transverse to the specimen loading axis were used because the minor Poisson's ratio(v2) may be determined from E,E2,and vi2.Each specimen was tested in a general-purpose testing machine at a crosshead rate of 2 mm/min.Specimen load and strains were sampled throughout the test using a PC-driven data acquisition system.The specimens were loaded to failure. Specimen Dimensions Specimen cross-sectional dimensions were recorded as follows: Specimen Orientation(deg)Width(w)(mm) Thickness (t)(mm) 1 0 12.78 1.067 3 0 12.78 1.067 3 0 12.65 1.067 0 12.75 1.067 90 25.40 2.184 6 90 25.35 2.185 7 90 25.45 2.134 8 90 25.53 2.236 Stress-Strain Data The load readings were converted to axial stress readings using the cross- sectional dimensions reported above.Examples of stress and strain data recorded using the data acquisition system are tabulated below. Stress-Strain Data for Specimen 2 ([0]s)(Reduced Set from Original Record) The last two columns are strain readings from the same strain gage rosette. C:(MPa) E(ustrain) E(ustrain) -e2(ustrain) 0 0 10 0 36 310 320 120 72 590 600 200 108 860 870 280 144 1,140 1160 340 180 1,420 1440 420 252 2,010 2,000 570 395 3,050 3,030 880 647 4,900 4850 1380 1.006 7,490 7,430 2.040 1,294 9,470 9.420 2540 1,617 11,640 11590 3,070 1,9772 14,060 13.990 3,610 a Ultimate stress. ©2003 by CRC Press LLCspecimens, a single-element strain gage oriented along the length of the specimen was bonded to each surface of the specimen in the gage section to determine the axial stress–strain response. No strain gages transverse to the specimen loading axis were used because the minor Poisson’s ratio (ν21) may be determined from E1, E2, and ν12. Each specimen was tested in a general-purpose testing machine at a crosshead rate of 2 mm/min. Specimen load and strains were sampled throughout the test using a PC-driven data acquisition system. The specimens were loaded to failure. Specimen Dimensions Specimen cross-sectional dimensions were recorded as follows: Stress–Strain Data The load readings were converted to axial stress readings using the crosssectional dimensions reported above. Examples of stress and strain data recorded using the data acquisition system are tabulated below. Specimen Orientation (deg) Width (w) (mm) Thickness (t) (mm) 1 0 12.78 1.067 2 0 12.78 1.067 3 0 12.65 1.067 4 0 12.75 1.067 5 90 25.40 2.184 6 90 25.35 2.185 7 90 25.45 2.134 8 90 25.53 2.236 Stress-Strain Data for Specimen 2 ([0]8) (Reduced Set from Original Record) The last two columns are strain readings from the same strain gage rosette. σ1 (MPa) ε1 (µstrain) ε1 (µstrain) –ε2 (µstrain) 0 0 10 0 36 310 320 120 72 590 600 200 108 860 870 280 144 1,140 1,160 340 180 1,420 1,440 420 252 2,010 2,000 570 395 3,050 3,030 880 647 4,900 4,850 1,380 1,006 7,490 7,430 2,040 1,294 9,470 9,420 2,540 1,617 11,640 11,590 3,070 1,977a 14,060 13,990 3,610 a Ultimate stress. TX001_AppC_Frame Page 228 Saturday, September 21, 2002 5:14 AM © 2003 by CRC Press LLC