正在加载图片...
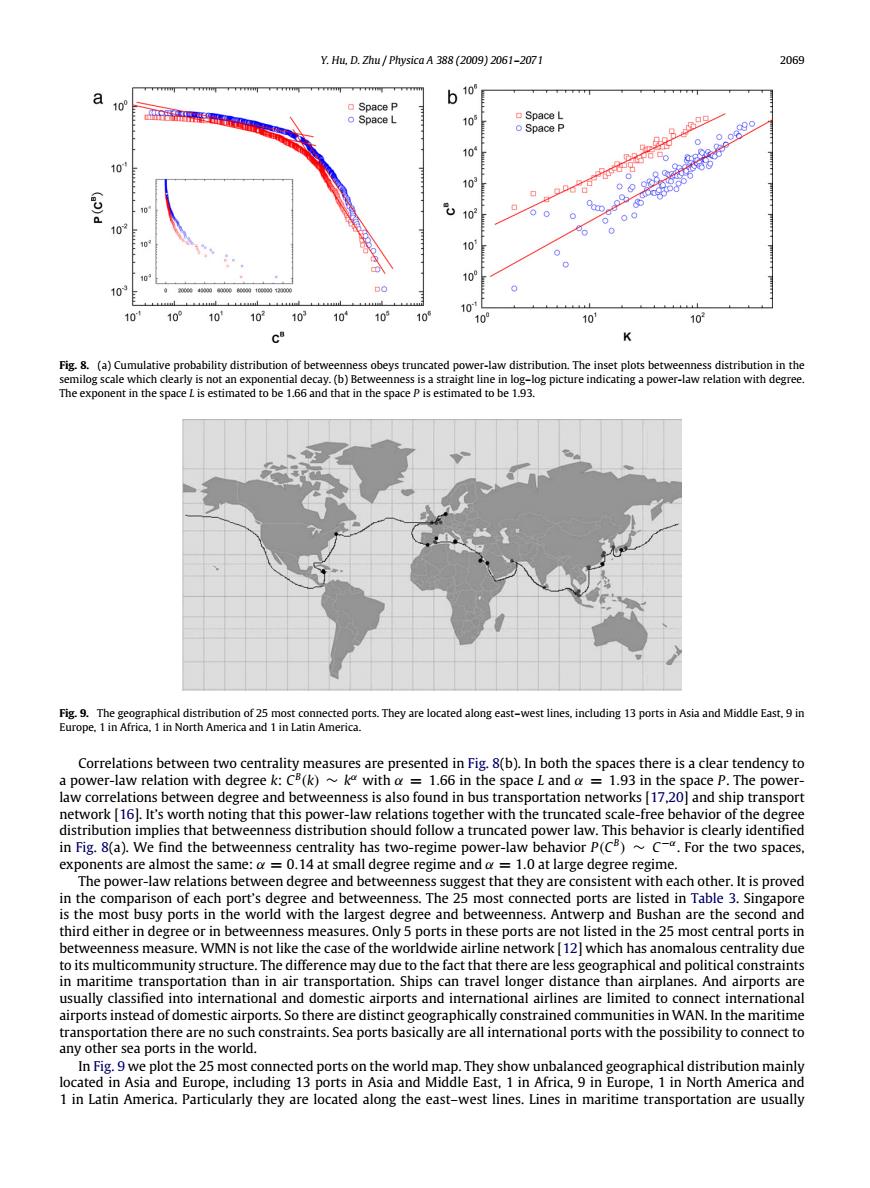
Y.Hu,D.Zhu Physica A 388(2009)2061-2071 2069 a 10 b 100 o Space P o Space L o Space L o Space P g90 10 10 6 10 00 10 10 40 10 103 10 10 10° 10 102 103 10° 103 10* 10° 10 10 Qo 个 Fig.8.(a)Cumulative probability distribution of betweenness obeys truncated power-law distribution.The inset plots betweenness distribution in the semilog scale which clearly is not an exponential decay.(b)Betweenness is a straight line in log-log picture indicating a power-law relation with degree. The exponent in the space L is estimated to be 1.66 and that in the space P is estimated to be 1.93. Fig.9.The geographical distribution of 25 most connected ports.They are located along east-west lines,including 13 ports in Asia and Middle East.9 in Europe,1 in Africa,1 in North America and 1 in Latin America. Correlations between two centrality measures are presented in Fig.8(b).In both the spaces there is a clear tendency to a power-law relation with degree k:C(k)~ke with a 1.66 in the space L and a =1.93 in the space P.The power- law correlations between degree and betweenness is also found in bus transportation networks[17,20]and ship transport network[161.It's worth noting that this power-law relations together with the truncated scale-free behavior of the degree distribution implies that betweenness distribution should follow a truncated power law.This behavior is clearly identified in Fig.8(a).We find the betweenness centrality has two-regime power-law behavior P(C)C-.For the two spaces. exponents are almost the same:o=0.14 at small degree regime and a =1.0 at large degree regime. The power-law relations between degree and betweenness suggest that they are consistent with each other.It is proved in the comparison of each port's degree and betweenness.The 25 most connected ports are listed in Table 3.Singapore is the most busy ports in the world with the largest degree and betweenness.Antwerp and Bushan are the second and third either in degree or in betweenness measures.Only 5 ports in these ports are not listed in the 25 most central ports in betweenness measure.WMN is not like the case of the worldwide airline network[12]which has anomalous centrality due to its multicommunity structure.The difference may due to the fact that there are less geographical and political constraints in maritime transportation than in air transportation.Ships can travel longer distance than airplanes.And airports are usually classified into international and domestic airports and international airlines are limited to connect international airports instead of domestic airports.So there are distinct geographically constrained communities in WAN.In the maritime transportation there are no such constraints.Sea ports basically are all international ports with the possibility to connect to any other sea ports in the world. In Fig.9 we plot the 25 most connected ports on the world map.They show unbalanced geographical distribution mainly located in Asia and Europe,including 13 ports in Asia and Middle East,1 in Africa,9 in Europe,1 in North America and 1 in Latin America.Particularly they are located along the east-west lines.Lines in maritime transportation are usuallyY. Hu, D. Zhu / Physica A 388 (2009) 2061–2071 2069 Fig. 8. (a) Cumulative probability distribution of betweenness obeys truncated power-law distribution. The inset plots betweenness distribution in the semilog scale which clearly is not an exponential decay. (b) Betweenness is a straight line in log–log picture indicating a power-law relation with degree. The exponent in the space L is estimated to be 1.66 and that in the space P is estimated to be 1.93. Fig. 9. The geographical distribution of 25 most connected ports. They are located along east–west lines, including 13 ports in Asia and Middle East, 9 in Europe, 1 in Africa, 1 in North America and 1 in Latin America. Correlations between two centrality measures are presented in Fig. 8(b). In both the spaces there is a clear tendency to a power-law relation with degree k: C B (k) ∼ k α with α = 1.66 in the space L and α = 1.93 in the space P. The powerlaw correlations between degree and betweenness is also found in bus transportation networks [17,20] and ship transport network [16]. It’s worth noting that this power-law relations together with the truncated scale-free behavior of the degree distribution implies that betweenness distribution should follow a truncated power law. This behavior is clearly identified in Fig. 8(a). We find the betweenness centrality has two-regime power-law behavior P(C B ) ∼ C −α . For the two spaces, exponents are almost the same: α = 0.14 at small degree regime and α = 1.0 at large degree regime. The power-law relations between degree and betweenness suggest that they are consistent with each other. It is proved in the comparison of each port’s degree and betweenness. The 25 most connected ports are listed in Table 3. Singapore is the most busy ports in the world with the largest degree and betweenness. Antwerp and Bushan are the second and third either in degree or in betweenness measures. Only 5 ports in these ports are not listed in the 25 most central ports in betweenness measure. WMN is not like the case of the worldwide airline network [12] which has anomalous centrality due to its multicommunity structure. The difference may due to the fact that there are less geographical and political constraints in maritime transportation than in air transportation. Ships can travel longer distance than airplanes. And airports are usually classified into international and domestic airports and international airlines are limited to connect international airports instead of domestic airports. So there are distinct geographically constrained communities in WAN. In the maritime transportation there are no such constraints. Sea ports basically are all international ports with the possibility to connect to any other sea ports in the world. In Fig. 9 we plot the 25 most connected ports on the world map. They show unbalanced geographical distribution mainly located in Asia and Europe, including 13 ports in Asia and Middle East, 1 in Africa, 9 in Europe, 1 in North America and 1 in Latin America. Particularly they are located along the east–west lines. Lines in maritime transportation are usually