正在加载图片...
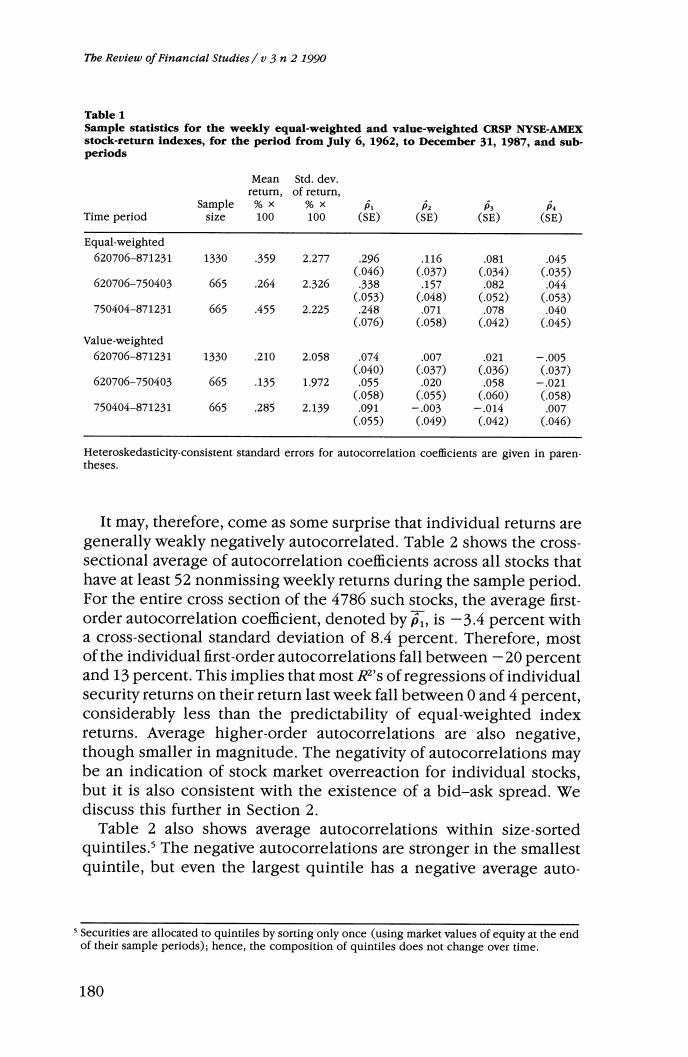
The Review of Financial Studies /v 3 n 2 1990 Table 1 Sample statistics for the weekly equal-weighted and value-weighted CRSP NYSE-AMEX stock-return indexes,for the period from July 6,1962,to December 31,1987,and sub- periods Mean Std.dev. return, of return, Sample %× %× P Time period size 100 100 (SE) (SE) (SE) (SE) Equal-weighted 620706-871231 1330 359 2.277 296 .116 .081 .045 (.046) (.037) (.034) (.035) 620706-750403 665 264 2.326 338 .157 .082 .044 (.053) (.048) (.052) (.053) 750404-871231 665 .455 2.225 ,248 .071 .078 .040 (.076) (.058) (.042) (.045) Value-weighted 620706-871231 1330 ,210 2.058 .074 .007 .021 -.005 (.040) (.037) (.036) (.037) 620706-750403 665 .135 1.972 .055 .020 .058 -.021 (.058) (.055) (.060) (.058) 750404-871231 665 ,285 2.139 .091 -.003 -.014 .007 (.055) (.049) (.042) (.046) Heteroskedasticity-consistent standard errors for autocorrelation coefficlents are given in paren- theses. It may,therefore,come as some surprise that individual returns are generally weakly negatively autocorrelated.Table 2 shows the cross- sectional average of autocorrelation coefficients across all stocks that have at least 52 nonmissing weekly returns during the sample period. For the entire cross section of the 4786 such stocks,the average first- order autocorrelation coefficient,denoted by p,is-3.4 percent with a cross-sectional standard deviation of 8.4 percent.Therefore,most of the individual first-order autocorrelations fall between-20 percent and 13 percent.This implies that most R2's of regressions of individual security returns on their return last week fall between 0 and 4 percent, considerably less than the predictability of equal-weighted index returns.Average higher-order autocorrelations are also negative, though smaller in magnitude.The negativity of autocorrelations may be an indication of stock market overreaction for individual stocks, but it is also consistent with the existence of a bid-ask spread.We discuss this further in Section 2. Table 2 also shows average autocorrelations within size-sorted quintiles.s The negative autocorrelations are stronger in the smallest quintile,but even the largest quintile has a negative average auto- s Securities are allocated to quintiles by sorting only once (using market values of equity at the end of their sample periods);hence,the composition of quintiles does not change over time. 180