正在加载图片...

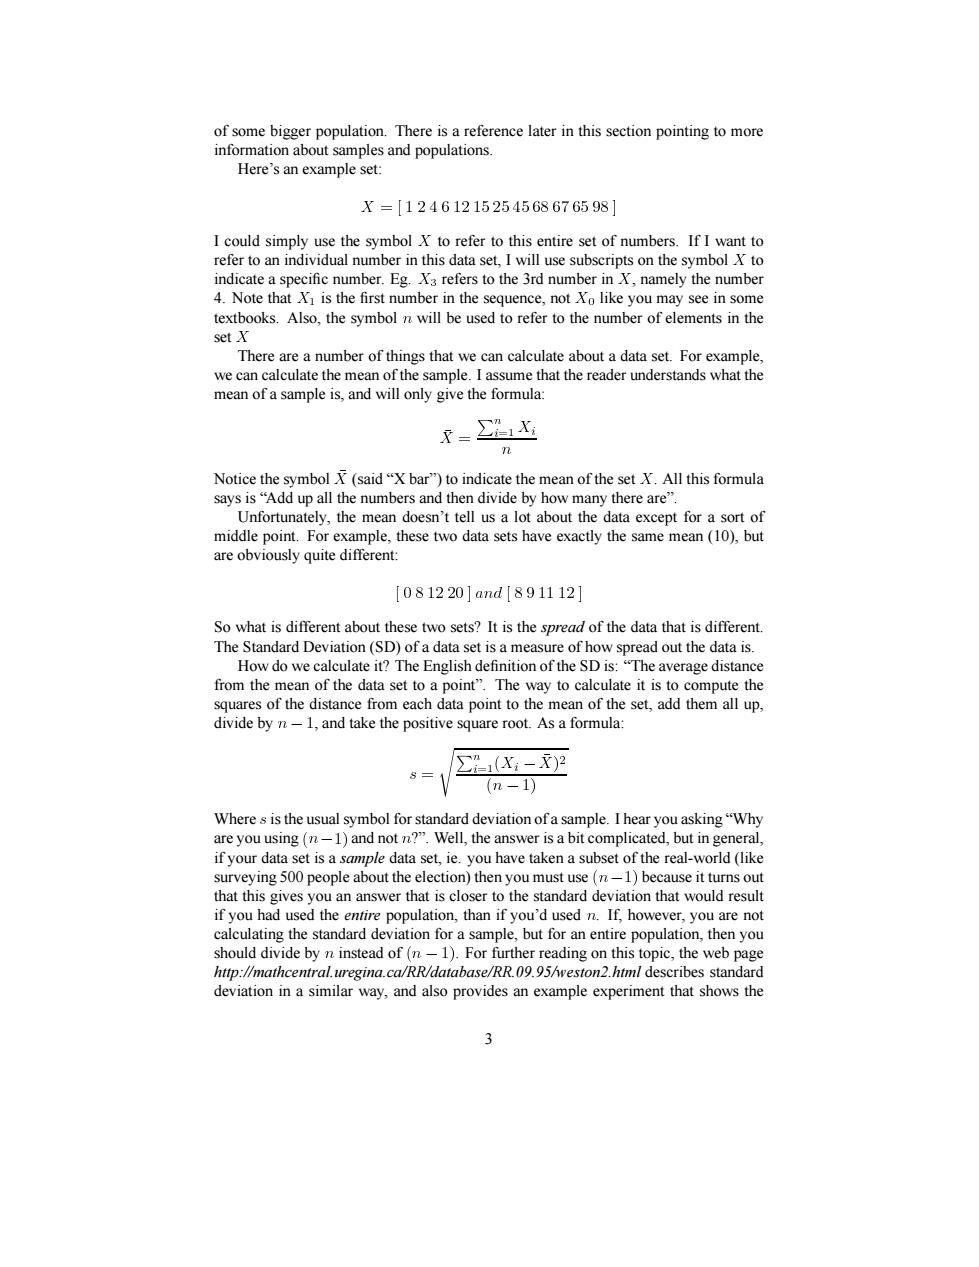
of some bigger population.There is a reference later in this section pointing to more information about samples and populations Here's an example set: X=[12461215254568676598] I could simply use the symbol X to refer to this entire set of numbers.If I want to refer to an individual number in this data set,I will use subscripts on the symbol X to indicate a specific number.Eg.X3 refers to the 3rd number in X,namely the number 4.Note that Xi is the first number in the sequence,not Xo like you may see in some textbooks.Also,the symbol n will be used to refer to the number of elements in the setX There are a number of things that we can calculate about a data set.For example, we can calculate the mean of the sample.I assume that the reader understands what the mean of a sample is,and will only give the formula: X=EHX Notice the symbol X(said "X bar")to indicate the mean of the set X.All this formula says is"Add up all the numbers and then divide by how many there are". Unfortunately,the mean doesn't tell us a lot about the data except for a sort of middle point.For example,these two data sets have exactly the same mean(10),but are obviously quite different [081220]and[891112] So what is different about these two sets?It is the spread of the data that is different. The Standard Deviation(SD)of a data set is a measure of how spread out the data is. How do we calculate it?The English definition of the SD is:"The average distance from the mean of the data set to a point".The way to calculate it is to compute the squares of the distance from each data point to the mean of the set,add them all up, divide by n-1,and take the positive square root.As a formula: =1(Xi-)2 (n-1) Where s is the usual symbol for standard deviation ofa sample.I hear you asking"Why are you using(n-1)and not n?".Well,the answer is a bit complicated,but in general, if your data set is a sample data set,ie.you have taken a subset of the real-world (like surveying 500 people about the election)then you must use(n-1)because it turns out that this gives you an answer that is closer to the standard deviation that would result if you had used the entire population,than if you'd used n.If,however,you are not calculating the standard deviation for a sample,but for an entire population,then you should divide by n instead of(n-1).For further reading on this topic,the web page http://mathcentral.uregina.ca/RR/database/RR.09.95/weston2.html describes standard deviation in a similar way,and also provides an example experiment that shows the 3of some bigger population. There is a reference later in this section pointing to more information about samples and populations. Here’s an example set: ✂✁☎✄✝✆✟✞✡✠✡☛☞✆✌✞✍✆✌✎✡✞✏✎✡✠✏✎✡☛✒✑✓☛✕✔✖☛✏✎✡✗✏✑✡✘ I could simply use the symbol to refer to this entire set of numbers. If I want to refer to an individual number in this data set, I will use subscripts on the symbol to indicate a specific number. Eg. ✚✙ refers to the 3rd number in , namely the number 4. Note that ✜✛ is the first number in the sequence, not ✚✢ like you may see in some textbooks. Also, the symbol ✣ will be used to refer to the number of elements in the set There are a number of things that we can calculate about a data set. For example, we can calculate the mean of the sample. I assume that the reader understands what the mean of a sample is, and will only give the formula: ✥✁ ✤ ✦✧✩★ ✛ ✧ ✣ Notice the symbol ✤ (said “X bar”) to indicate the mean of the set . All this formula says is “Add up all the numbers and then divide by how many there are”. Unfortunately, the mean doesn’t tell us a lot about the data except for a sort of middle point. For example, these two data sets have exactly the same mean (10), but are obviously quite different: ✄✫✪✬✑✍✆✫✞✡✞✏✪✡✘✕✭✣✯✮ ✄✰✑✡✗✱✆✒✆✓✆✌✞✡✘ So what is different about these two sets? It is the spread of the data that is different. The Standard Deviation (SD) of a data set is a measure of how spread out the data is. How do we calculate it? The English definition of the SD is: “The average distance from the mean of the data set to a point”. The way to calculate it is to compute the squares of the distance from each data point to the mean of the set, add them all up, divide by ✣✳✲ ✆ , and take the positive square root. As a formula: ✴ ✁ ✦✧✩★ ✛✶✵ ✧ ✲ ✸✷✺✹ ✤ ✵✣✜✲ ✆✒✷ Where ✴ is the usual symbol for standard deviation of a sample. I hear you asking “Why are you using ✵✣✻✲ ✆✒✷ and not ✣?”. Well, the answer is a bit complicated, but in general, if your data set is a sample data set, ie. you have taken a subset of the real-world (like surveying 500 people about the election) then you must use ✵✣✼✲ ✆✏✷ because it turns out that this gives you an answer that is closer to the standard deviation that would result if you had used the entire population, than if you’d used ✣. If, however, you are not calculating the standard deviation for a sample, but for an entire population, then you should divide by ✣ instead of ✵✣✽✲ ✆✒✷ . For further reading on this topic, the web page http://mathcentral.uregina.ca/RR/database/RR.09.95/weston2.html describes standard deviation in a similar way, and also provides an example experiment that shows the 3