正在加载图片...
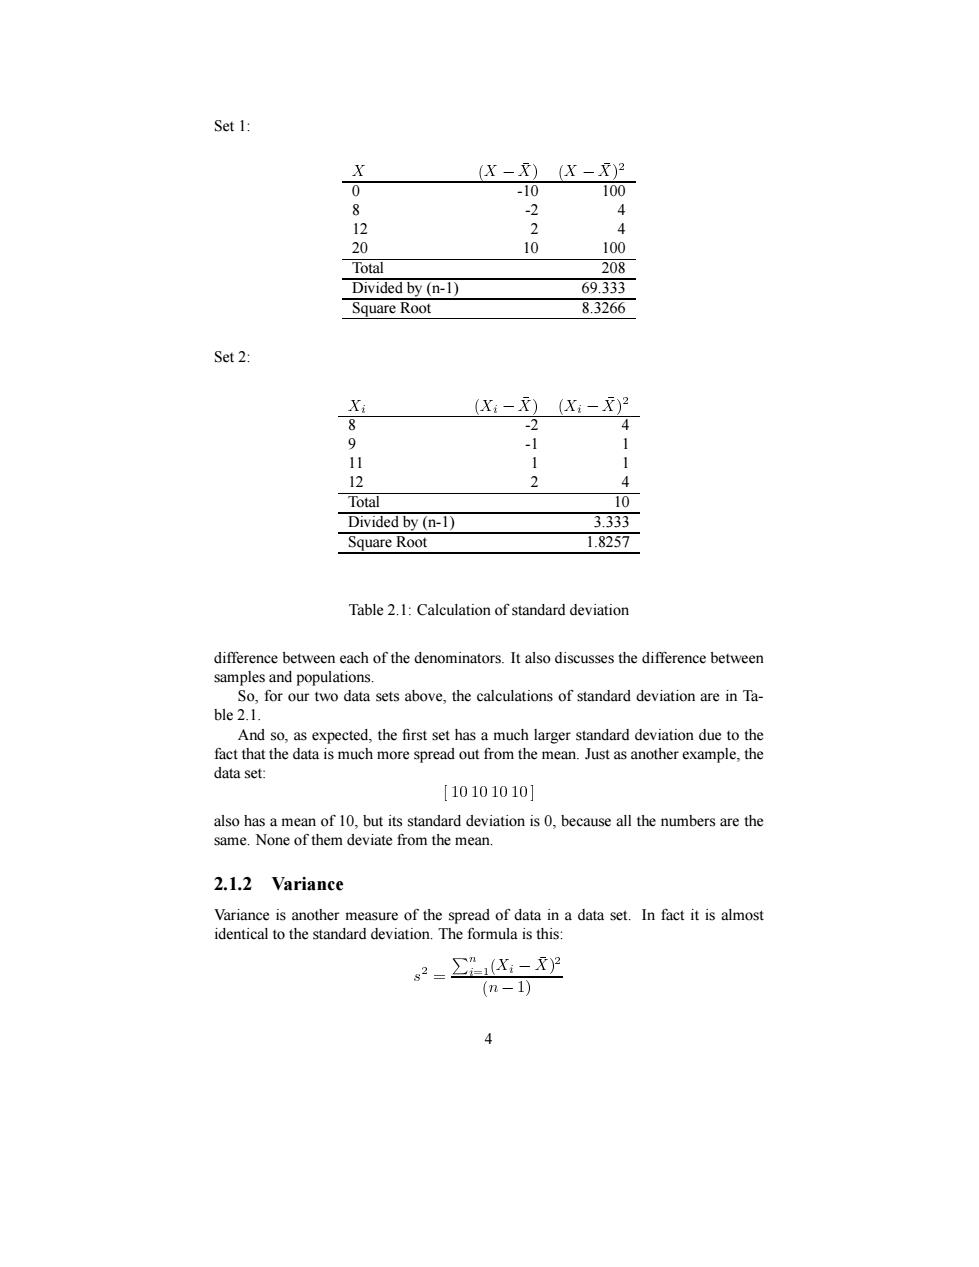
Set 1: X (X-) (X-)2 0 -10 100 8 -2 4 12 2 20 10 100 Total 208 Divided by (n-1) 69.333 Square Root 8.3266 Set 2: Xi (X:-X)(X:-)2 8 -2 4 -1 11 1 1 12 2 Total 10 Divided by (n-1) 3.333 Square Root 1.8257 Table 2.1:Calculation of standard deviation difference between each of the denominators.It also discusses the difference between samples and populations. So,for our two data sets above,the calculations of standard deviation are in Ta- ble 2.1. And so,as expected,the first set has a much larger standard deviation due to the fact that the data is much more spread out from the mean.Just as another example,the data set: [10101010] also has a mean of 10,but its standard deviation is 0,because all the numbers are the same.None of them deviate from the mean. 2.1.2 Variance Variance is another measure of the spread of data in a data set.In fact it is almost identical to the standard deviation.The formula is this: s2=∑X:-X (n-1) 4Set 1: ✵ ✲ ✸✷ ✤ ✵ ✲ ✸✷ ✤ ✹ 0 -10 100 8 -2 4 12 2 4 20 10 100 Total 208 Divided by (n-1) 69.333 Square Root 8.3266 Set 2: ✧ ✵ ✧ ✲ ✸✷ ✤ ✵ ✧ ✲ ✸✷ ✤ ✹ 8 -2 4 9 -1 1 11 1 1 12 2 4 Total 10 Divided by (n-1) 3.333 Square Root 1.8257 Table 2.1: Calculation of standard deviation difference between each of the denominators. It also discusses the difference between samples and populations. So, for our two data sets above, the calculations of standard deviation are in Table 2.1. And so, as expected, the first set has a much larger standard deviation due to the fact that the data is much more spread out from the mean. Just as another example, the data set: ✄✝✆✌✪✍✆✌✪✍✆✫✪✍✆✫✪✡✘ also has a mean of 10, but its standard deviation is 0, because all the numbers are the same. None of them deviate from the mean. 2.1.2 Variance Variance is another measure of the spread of data in a data set. In fact it is almost identical to the standard deviation. The formula is this: ✴ ✹ ✁ ✦✧✾★ ✛ ✵ ✧ ✲ ✸✷ ✤ ✹ ✵✣✿✲ ✆✒✷ 4