正在加载图片...

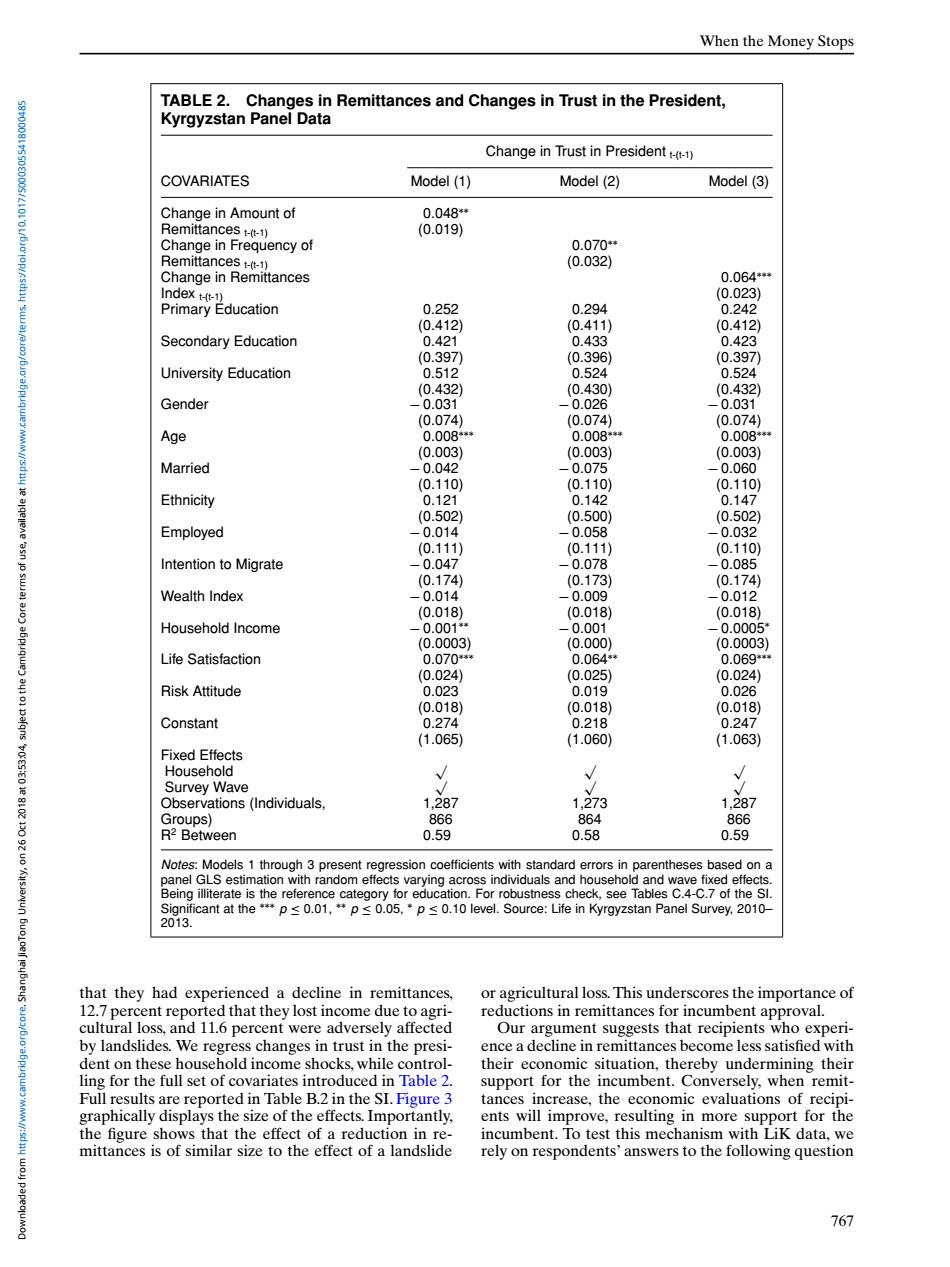
When the Money Stops TABLE 2.Changes in Remittances and Changes in Trust in the President, Kyrgyzstan Panel Data Change in Trust in President() COVARIATES Model(1) Model(2) Model(3) Change in Amount of 0.048* Remittances t-(t-1) (0.019) Change in Frequency of 0.070* Remittances t-(t-1) (0.032) Change in Remittances 0.064** Index H(t-1) (0.023) Primary Education 0.252 0.294 0.242 (0.412) (0.411) (0.412) Secondary Education 0.421 0.433 0.423 (0.397 (0.396) (0.397) University Education 0.512 0.524 0.524 (0.432) (0.430) (0.432) Gender -0.031 -0.026 -0.031 (0.074) (0.074) (0.074) Age 0.008** 0.008** 0.008** (0.003) (0.003) (0.003) Married -0.042 -0.075 -0.060 (0.110) (0.110) (0.110) Ethnicity 0.121 0.142 0.147 (0.502) (0.500) (0.502) Employed -0.014 -0.058 -0.032 (0.111) (0.111) (0.110) Intention to Migrate -0.047 -0.078 -0.085 (0.174) (0.173) (0.174) Wealth Index -0.014 -0.009 -0.012 (0.018) (0.018) (0.018) Household Income -0.001* -0.001 -0.0005* (0.0003) (0.000) (0.0003) Life Satisfaction 0.070* 0.064* 0.069** (0.024) (0.025) (0.024) Risk Attitude 0.023 0.019 0.026 (0.018) (0.018) (0.018) Constant 0.274 0.218 0.247 (1.065) (1.060) (1.063) Fixed Effects Household √ Survey Wave Observations(Individuals. 1.287 1.273 1.287 Groups) 866 864 866 R2 Between 0.59 0.58 0.59 Notes:Models 1 through 3 present regression coefficients with standard errors in parentheses based on a panel GLS estimation with random effects varying across individuals and household and wave fixed effects. Being illiterate is the reference category for education.For robustness check,see Tables C.4-C.7 of the Sl. Significant at the*p≤0.01,+p≤0.05,*p≤0.10 level.Source:Life in Kyrgyzstan Panel Survey,.2010- 2013. that they had experienced a decline in remittances. or agricultural loss.This underscores the importance of 12.7 percent reported that they lost income due to agri- reductions in remittances for incumbent approval. cultural loss,and 11.6 percent were adversely affected Our argument suggests that recipients who experi- by landslides.We regress changes in trust in the presi- ence a decline in remittances become less satisfied with dent on these household income shocks,while control- their economic situation,thereby undermining their ling for the full set of covariates introduced in Table 2. support for the incumbent.Conversely,when remit- Full results are reported in Table B.2 in the SI.Figure 3 tances increase,the economic evaluations of recipi- M//:sdny graphically displays the size of the effects.Importantly, ents will improve,resulting in more support for the the figure shows that the effect of a reduction in re- incumbent.To test this mechanism with LiK data,we mittances is of similar size to the effect of a landslide rely on respondents'answers to the following question 767When the Money Stops TABLE 2. Changes in Remittances and Changes in Trust in the President, Kyrgyzstan Panel Data Change in Trust in President t-(t-1) COVARIATES Model (1) Model (2) Model (3) Change in Amount of 0.048∗∗ Remittances t-(t-1) (0.019) Change in Frequency of 0.070∗∗ Remittances t-(t-1) (0.032) Change in Remittances 0.064∗∗∗ Index t-(t-1) (0.023) Primary Education 0.252 0.294 0.242 (0.412) (0.411) (0.412) Secondary Education 0.421 0.433 0.423 (0.397) (0.396) (0.397) University Education 0.512 0.524 0.524 (0.432) (0.430) (0.432) Gender − 0.031 − 0.026 − 0.031 (0.074) (0.074) (0.074) Age 0.008∗∗∗ 0.008∗∗∗ 0.008∗∗∗ (0.003) (0.003) (0.003) Married − 0.042 − 0.075 − 0.060 (0.110) (0.110) (0.110) Ethnicity 0.121 0.142 0.147 (0.502) (0.500) (0.502) Employed − 0.014 − 0.058 − 0.032 (0.111) (0.111) (0.110) Intention to Migrate − 0.047 − 0.078 − 0.085 (0.174) (0.173) (0.174) Wealth Index − 0.014 − 0.009 − 0.012 (0.018) (0.018) (0.018) Household Income − 0.001∗∗ − 0.001 − 0.0005∗ (0.0003) (0.000) (0.0003) Life Satisfaction 0.070∗∗∗ 0.064∗∗ 0.069∗∗∗ (0.024) (0.025) (0.024) Risk Attitude 0.023 0.019 0.026 (0.018) (0.018) (0.018) Constant 0.274 0.218 0.247 (1.065) (1.060) (1.063) Fixed Effects Household √√√ Survey Wave √√√ Observations (Individuals, 1,287 1,273 1,287 Groups) 866 864 866 R2 Between 0.59 0.58 0.59 Notes: Models 1 through 3 present regression coefficients with standard errors in parentheses based on a panel GLS estimation with random effects varying across individuals and household and wave fixed effects. Being illiterate is the reference category for education. For robustness check, see Tables C.4-C.7 of the SI. Significant at the ∗∗∗ p ≤ 0.01, ∗∗ p ≤ 0.05, ∗ p ≤ 0.10 level. Source: Life in Kyrgyzstan Panel Survey, 2010– 2013. that they had experienced a decline in remittances, 12.7 percent reported that they lost income due to agricultural loss, and 11.6 percent were adversely affected by landslides. We regress changes in trust in the president on these household income shocks, while controlling for the full set of covariates introduced in Table 2. Full results are reported in Table B.2 in the SI. Figure 3 graphically displays the size of the effects. Importantly, the figure shows that the effect of a reduction in remittances is of similar size to the effect of a landslide or agricultural loss. This underscores the importance of reductions in remittances for incumbent approval. Our argument suggests that recipients who experience a decline in remittances become less satisfied with their economic situation, thereby undermining their support for the incumbent. Conversely, when remittances increase, the economic evaluations of recipients will improve, resulting in more support for the incumbent. To test this mechanism with LiK data, we rely on respondents’ answers to the following question 767 Downloaded from https://www.cambridge.org/core. Shanghai JiaoTong University, on 26 Oct 2018 at 03:53:04, subject to the Cambridge Core terms of use, available at https://www.cambridge.org/core/terms. https://doi.org/10.1017/S0003055418000485