正在加载图片...
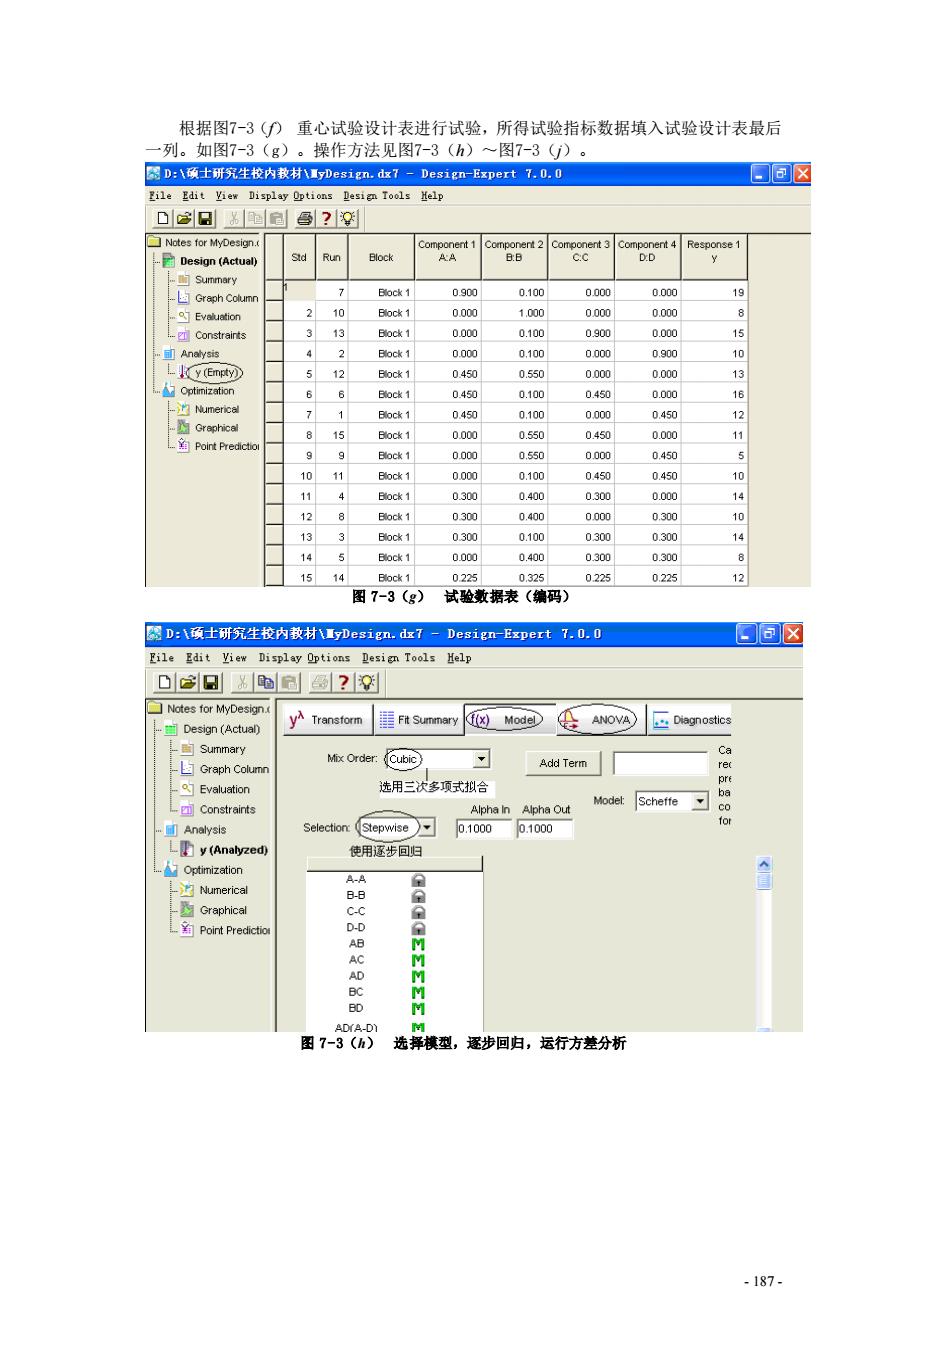
根据图7-3()重心试验设计表进行试验,所得试验指标数据填入试验设计表最后 列。如图7-3(g)。操作方法见图7-3(h)~图7-3()。 图D:\颈士研究生校内软材小yDesign,d7-Design-Expert 7.0,0 口@☒ 里i1 e Edit View Display Options esign Tools He1p D3日品画自? Notes for MyDesign. Component 3 Component 4 Response 1 Design (Actual) Run Block AA cc D:D -的Summary ☒Graph Column Block 1 0.900 0.100 0.000 0.000 19 Evaluation 2 10 Block 1 0.000 1.000 0000 0.000 Constraints 3 Block 1 0.000 0.100 0.900 0.000 15 .Analysis Block 1 0.000 0.100 0000 0.900 10 Ly(Empty) 12 Block 1 0.450 0.550 0000 0.000 13 Optimization 6 6 Block 1 0.450 0.100 0.450 0.000 16 Numerical 1 Block 1 0.450 0.100 0000 0.450 12 Grephical 15 Block 1 0.000 0.550 0.450 0.000 11 _角Point Predictio 9 Block 1 0.000 0.550 0.000 0.450 10 11 0.000 0.100 0.450 0.450 10 Block 1 0.300 0.400 0.300 0.000 14 12 8 Block 1 0.300 0.400 0.000 0.300 10 13 3 Block 1 0.300 0.100 0.300 0.300 14 14 5 Block 1 0.000 0.400 0.300 0.300 15 14 Block 1 0225 0.325 0225 0.225 12 图7-3(g) 试验数据表(编码) 圆D:八项士研究生校内教材IyDesign.dz7-Desigr-Expert7.0.0 ✉@☒ File Edit View Display Options Design Tools Help 0它日雕 圖? ▣Notes for MyDesign .Design (Actual) y Transform Fit Summary f(x)Model ANOVA .Diagnostics _白Summary Mix Order: Ca -L Graph Column Cubic 可 Add Term Evaluation 选用三次多项式拟合 LConstraints Modet: Alpha In Alpha Out Scheffe Selection (Stepwise 0.1000 for .Analysis 0.1000 Ly (Analyzed) 使用逐步回归 .Optimization A-A Numerical B-8 金 Graphical C-C .Point Predictio D-D AB AC AD M BC BD ADYA-DY 图7-3(h) 选择模型,逐步回归,运行方差分析 -187-- 187 - 根据图7-3(f) 重心试验设计表进行试验,所得试验指标数据填入试验设计表最后 一列。如图7-3(g)。操作方法见图7-3(h)~图7-3(j)。 图 7-3(g) 试验数据表(编码) 图 7-3(h) 选择模型,逐步回归,运行方差分析