正在加载图片...
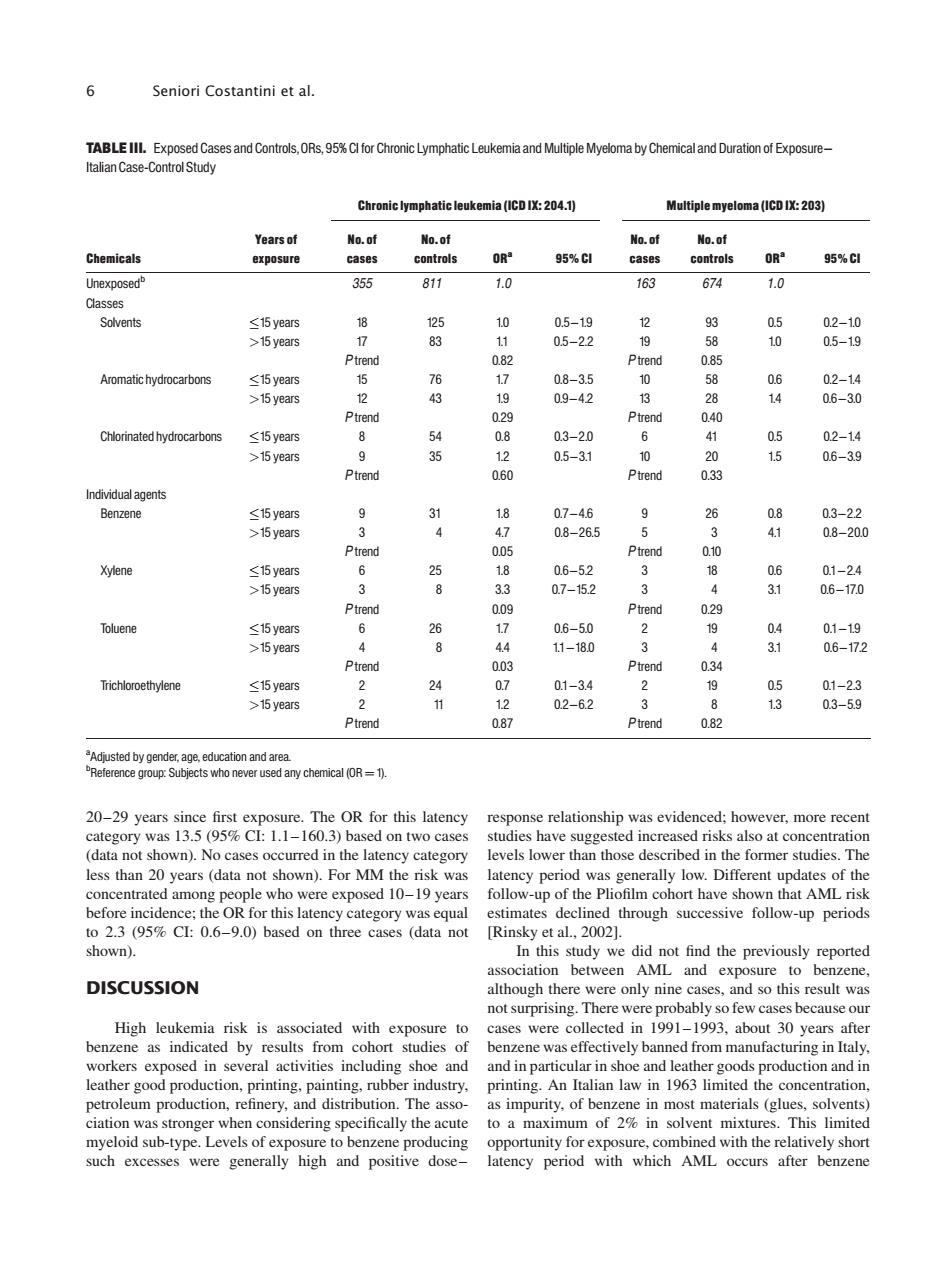
6 Seniori Costantini et al. Chron atic leukemia (ICD IX:204.1) ac0:203 n OR' 95%C 95%C 355 811 1.0 163 674 10 0179420 3815884 s-8 06 Chlorinated hydrocarbons ≤15year >15 vea 400 Benzene ≤15year 9 2 9 >15 years 58v 63 2 oluene 64 8 ≤15 years 话材6639740002 06 6310842944 0-92 >15 years 5 onshin (data not shown).No cases occurred in the latency category levels lower than those described in the former studies.The to 23(95 Cl:0.6-9.0)based on three cases (data not successi [Rinsky et al.,2002]. shown). In this study we did not find the previously reported DISCUSSION not surprising.There were probably so few cases because ou High leukemia risk is associated with exposure to cases were collected in 1991-1993.about 30 years after benzene as indicated by results from benzene was effectively banned from manufacturing in Italy. nsevera ctivities and in pa production petroleum production,refineryand.The sso as impurity,of benzene in most materials (glues,solvents ciation was stronger when considering specifically the acute to a maximum of 2%in solvent mixtures.This limited d with the e occurs20–29 years since first exposure. The OR for this latency category was 13.5 (95% CI: 1.1–160.3) based on two cases (data not shown). No cases occurred in the latency category less than 20 years (data not shown). For MM the risk was concentrated among people who were exposed 10–19 years before incidence; the OR for this latency category was equal to 2.3 (95% CI: 0.6–9.0) based on three cases (data not shown). DISCUSSION High leukemia risk is associated with exposure to benzene as indicated by results from cohort studies of workers exposed in several activities including shoe and leather good production, printing, painting, rubber industry, petroleum production, refinery, and distribution. The association was stronger when considering specifically the acute myeloid sub-type. Levels of exposure to benzene producing such excesses were generally high and positive dose– response relationship was evidenced; however, more recent studies have suggested increased risks also at concentration levels lower than those described in the former studies. The latency period was generally low. Different updates of the follow-up of the Pliofilm cohort have shown that AML risk estimates declined through successive follow-up periods [Rinsky et al., 2002]. In this study we did not find the previously reported association between AML and exposure to benzene, although there were only nine cases, and so this result was not surprising. There were probably so few cases because our cases were collected in 1991–1993, about 30 years after benzene was effectively banned from manufacturing in Italy, and in particular in shoe and leather goods production and in printing. An Italian law in 1963 limited the concentration, as impurity, of benzene in most materials (glues, solvents) to a maximum of 2% in solvent mixtures. This limited opportunity for exposure, combined with the relatively short latency period with which AML occurs after benzene TABLE III. Exposed Cases and Controls,ORs, 95% CI for Chronic Lymphatic Leukemia and Multiple Myeloma by Chemical and Duration of Exposure^ Italian Case-Control Study Chemicals Years of exposure Chronic lymphatic leukemia (ICDIX: 204.1) Multiple myeloma (ICDIX: 203) No. of cases No. of controls ORa 95% CI No. of cases No. of controls ORa 95% CI Unexposedb 355 811 1.0 163 674 1.0 Classes Solvents 15 years 18 125 1.0 0.5^1.9 12 93 0.5 0.2^1.0 >15 years 17 83 1.1 0.5^2.2 19 58 1.0 0.5^1.9 P trend 0.82 P trend 0.85 Aromatic hydrocarbons 15 years 15 76 1.7 0.8^3.5 10 58 0.6 0.2^1.4 >15 years 12 43 1.9 0.9^4.2 13 28 1.4 0.6^3.0 P trend 0.29 P trend 0.40 Chlorinated hydrocarbons 15 years 8 54 0.8 0.3^2.0 6 41 0.5 0.2^1.4 >15 years 9 35 1.2 0.5^3.1 10 20 1.5 0.6^3.9 P trend 0.60 P trend 0.33 Individual agents Benzene 15 years 9 31 1.8 0.7^4.6 9 26 0.8 0.3^2.2 >15 years 3 4 4.7 0.8^26.5 5 3 4.1 0.8^20.0 P trend 0.05 P trend 0.10 Xylene 15 years 6 25 1.8 0.6^5.2 3 18 0.6 0.1^2.4 >15 years 3 8 3.3 0.7^15.2 3 4 3.1 0.6^17.0 P trend 0.09 P trend 0.29 Toluene 15 years 6 26 1.7 0.6^5.0 2 19 0.4 0.1^1.9 >15 years 4 8 4.4 1.1^18.0 3 4 3.1 0.6^17.2 P trend 0.03 P trend 0.34 Trichloroethylene 15 years 2 24 0.7 0.1^3.4 2 19 0.5 0.1^2.3 >15 years 2 11 1.2 0.2^6.2 3 8 1.3 0.3^5.9 P trend 0.87 P trend 0.82 a Adjusted by gender, age, education and area. b Reference group: Subjects who never used any chemical (OR¼1). 6 Seniori Costantini et al.�������