正在加载图片...
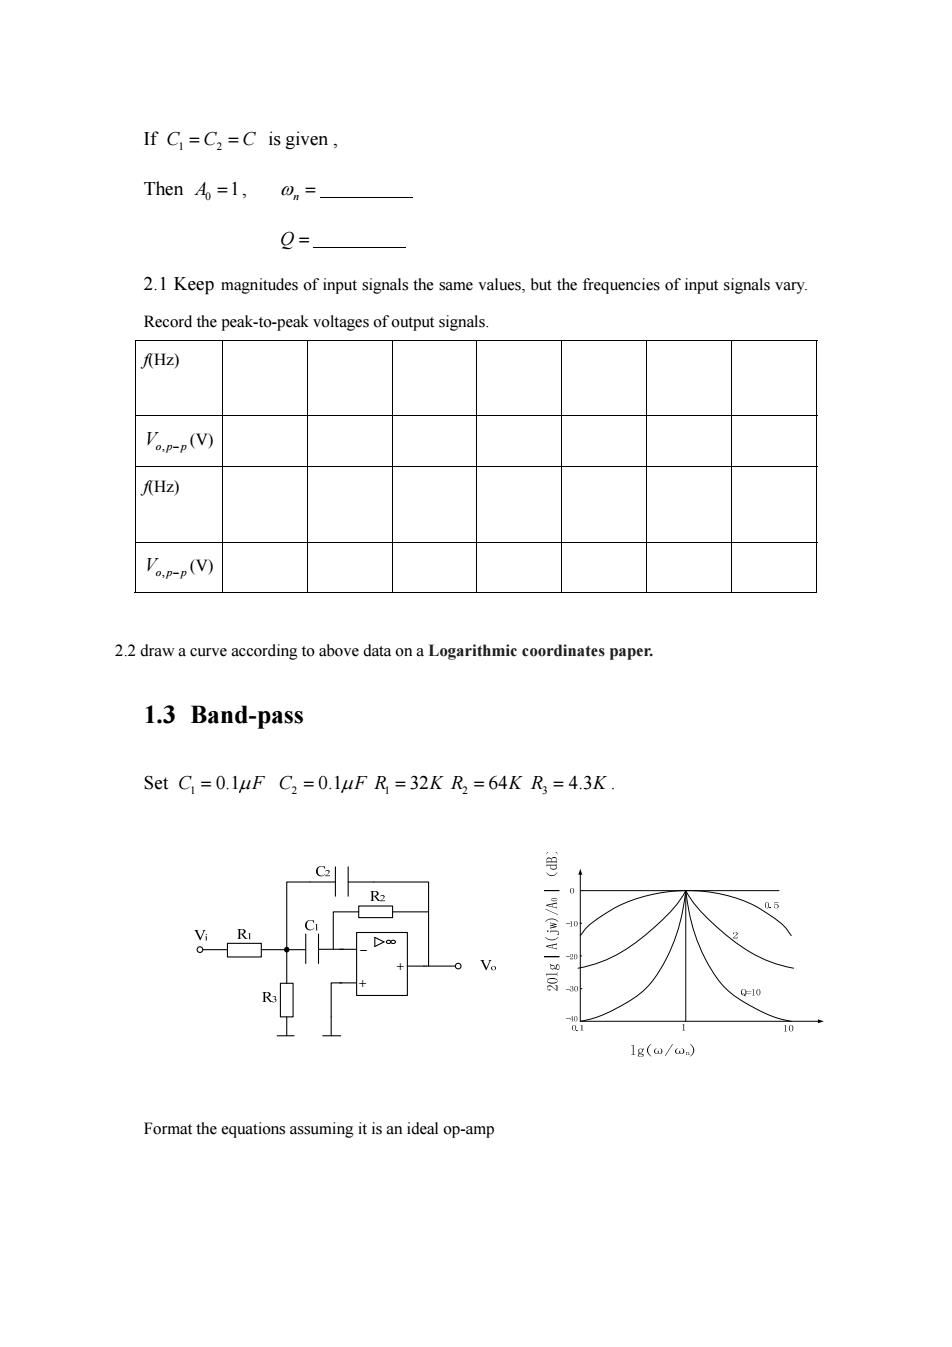
If C=C2=C is given, Then Ao=1, 0= 2.1 Keep magnitudes of input signals the same values,but the frequencies of input signals vary. Record the peak-to-peak voltages of output signals. Hz) V(V) AHz) (V) 2.2 draw a curve according to above data on a Logarithmic coordinates paper. 1.3 Band-pass Set C =0.1uF C,=0.1uF R =32K R =64K R3 =4.3K. =10 10 1g(@/0) Format the equations assuming it is an ideal op-ampIf CCC 1 2 is given , Then 0 A 1, n Q 2.1 Keep magnitudes of input signals the same values, but the frequencies of input signals vary. Record the peak-to-peak voltages of output signals. f(Hz) Vop p , (V) f(Hz) Vop p , (V) 2.2 draw a curve according to above data on a Logarithmic coordinates paper. 1.3 Band-pass Set 1 C F 0.1 2 C F 0.1 1 R 32K 2 R 64K R3 4.3K . Format the equations assuming it is an ideal op-amp