正在加载图片...

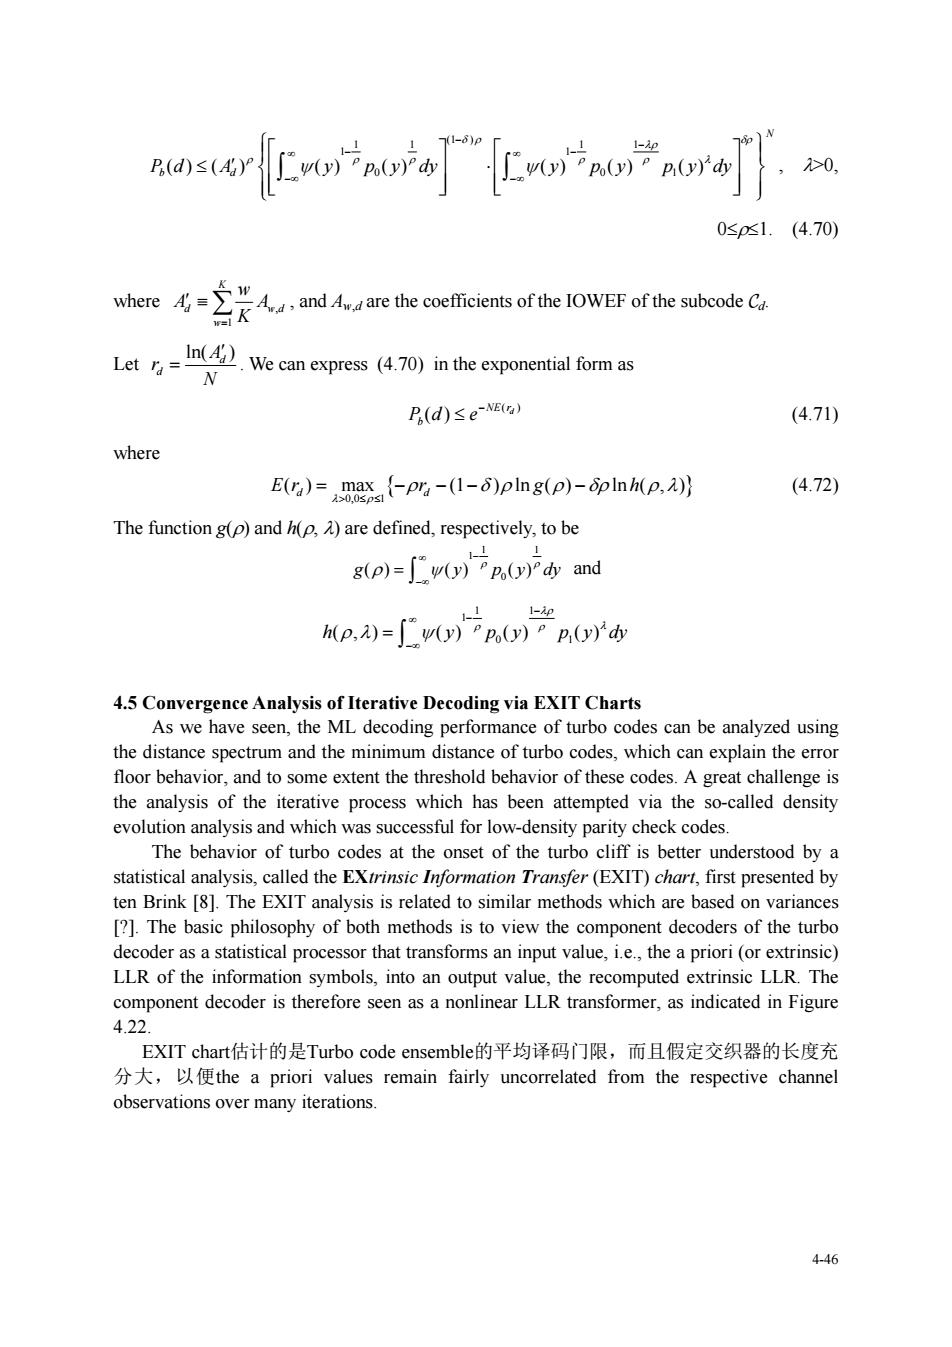
P(d)≤()P 0sps1.(4.70) Let We can express (4.70)in the exponential form as P(d)≤eE (4.71) where E(r)=max (-pr-(1-5)pIng(p)-6pInh(p.) (4.72) The functiong(p)and()are defined,respectively,to be g(p)=wy)Pp。y)"dy and A,=o产)BOYd 4.5 Convergence Analysis of Iterative Decoding via EXIT Charts As we have seen,the ML decoding performance of turbo codes can be analyzed using the distance spectrum and the minimum distance of turbo codes,which can explain the error floor behavior,and to some extent the threshold behavior of these codes.A great challenge is the analysis of the iterative process which has been attempted via the so-called density evolution nalysis and which uccessful for low-den par rity check codes statistical analysis,called the EXtrinsic Information Transfer (EXIT)chart,first presented by ten Brink [8].The EXIT analysis is related to similar methods which are based on variances [?]The basic philosophy of both methods is to view the component decoders of the turbo decoder as a statistical processor that transforms an input value,i.e,the a priori(or extrinsic) LLR of the info mation symbols,into an output valu the recomputed extrinsic LLR.The component decoder is therefore seen as a nonlinear LLR transformer,as indicated in Figure 4.22 EXIT chart估计的是Turbo code ensemble的平均译码门限,而且假定交织器的长度充 分大,以便the a priori values remain fairly uncorrelated from the respective channel observations over many iterations 4464-46 (1 ) 1 1 11 1 1 0 01 () ( ) () () () () () N P d A y p y dy y p y p y dy b d , >0, 01. (4.70) where , 1 K d wd w w A A K , and Aw,d are the coefficients of the IOWEF of the subcode d. Let ln( ) d d A r N . We can express (4.70) in the exponential form as ( ) ( ) NE rd Pd e b (4.71) where 0,0 1 ( ) max (1 ) ln ( ) ln ( , ) Er r g h d d (4.72) The function g() and h(, ) are defined, respectively, to be 1 1 1 0 g() () () y p y dy and 1 1 1 0 1 h y p y p y dy (,) () () () 4.5 Convergence Analysis of Iterative Decoding via EXIT Charts As we have seen, the ML decoding performance of turbo codes can be analyzed using the distance spectrum and the minimum distance of turbo codes, which can explain the error floor behavior, and to some extent the threshold behavior of these codes. A great challenge is the analysis of the iterative process which has been attempted via the so-called density evolution analysis and which was successful for low-density parity check codes. The behavior of turbo codes at the onset of the turbo cliff is better understood by a statistical analysis, called the EXtrinsic Information Transfer (EXIT) chart, first presented by ten Brink [8]. The EXIT analysis is related to similar methods which are based on variances [?]. The basic philosophy of both methods is to view the component decoders of the turbo decoder as a statistical processor that transforms an input value, i.e., the a priori (or extrinsic) LLR of the information symbols, into an output value, the recomputed extrinsic LLR. The component decoder is therefore seen as a nonlinear LLR transformer, as indicated in Figure 4.22. EXIT chart估计的是Turbo code ensemble的平均译码门限,而且假定交织器的长度充 分大,以便the a priori values remain fairly uncorrelated from the respective channel observations over many iterations