正在加载图片...
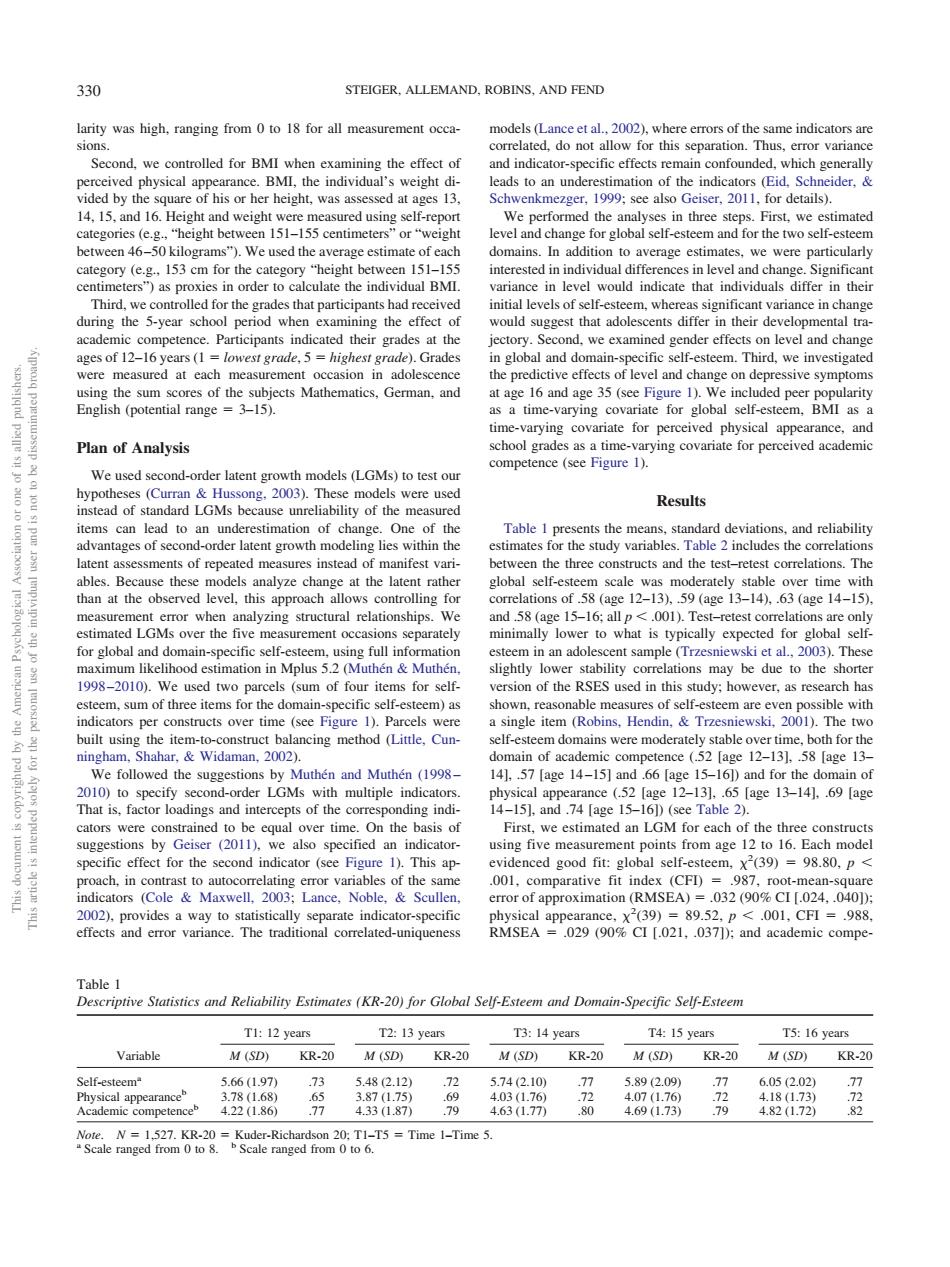
330 STEIGER.ALLEMAND.ROBINS.AND FEND high rangingIr all ond.we controlled for BMI when g the effect of e.BMI.the individual's weight ds to an underestimation of the indica 14,15.ndi60 es in thre First,we estimated "or vel and change for global the eategory (e.g 153 cm for the category "height betw cm151- s")as prox culate the would ind uggest that adole s differ in their lopmental tra their grades we exam of level and change on depressive sympiom ects Mathematics,German,and Plan of Analysis Ve used second atent Results Table 1 pres sents the means.standard deviations.and reliabilit tages of second-order late timates bles Because these nodels analyze change at the latent rather l-esem scale erately stable over timewith (age 58 stin sep imally lower to what 998-2010).We used two parcels (sum of four items for self version of the RSES used in this study:however,as research ha l 201)The We followed the suggestions by Muthen and Muthen (1998- 141.57 [age 14-15]and 66 [age 15-161)and for the domain of LGMs w multiple indi 65agc13-14.69ag ver time On theb Firs effeet for the (2 D Thi ating or variables vides a way to statisticall te indic ical annea 001cF=988 effects and error variance.The traditional comelated-uniqueness RMSEA .029 (90%CI [.021,.037));and academic compe TI:12 years T2:13 xears T3:14 years T4:15 years T5:16 years Variable M (SD)KR-20 M(SD)KR-20 M (SD)KR-20 M (SD)KR-20 M (SD)KR-20 ed825=Tine 1-Timelarity was high, ranging from 0 to 18 for all measurement occasions. Second, we controlled for BMI when examining the effect of perceived physical appearance. BMI, the individual’s weight divided by the square of his or her height, was assessed at ages 13, 14, 15, and 16. Height and weight were measured using self-report categories (e.g., “height between 151–155 centimeters” or “weight between 46 –50 kilograms”). We used the average estimate of each category (e.g., 153 cm for the category “height between 151–155 centimeters”) as proxies in order to calculate the individual BMI. Third, we controlled for the grades that participants had received during the 5-year school period when examining the effect of academic competence. Participants indicated their grades at the ages of 12–16 years (1 lowest grade, 5 highest grade). Grades were measured at each measurement occasion in adolescence using the sum scores of the subjects Mathematics, German, and English (potential range 3–15). Plan of Analysis We used second-order latent growth models (LGMs) to test our hypotheses (Curran & Hussong, 2003). These models were used instead of standard LGMs because unreliability of the measured items can lead to an underestimation of change. One of the advantages of second-order latent growth modeling lies within the latent assessments of repeated measures instead of manifest variables. Because these models analyze change at the latent rather than at the observed level, this approach allows controlling for measurement error when analyzing structural relationships. We estimated LGMs over the five measurement occasions separately for global and domain-specific self-esteem, using full information maximum likelihood estimation in Mplus 5.2 (Muthén & Muthén, 1998 –2010). We used two parcels (sum of four items for selfesteem, sum of three items for the domain-specific self-esteem) as indicators per constructs over time (see Figure 1). Parcels were built using the item-to-construct balancing method (Little, Cunningham, Shahar, & Widaman, 2002). We followed the suggestions by Muthén and Muthén (1998 – 2010) to specify second-order LGMs with multiple indicators. That is, factor loadings and intercepts of the corresponding indicators were constrained to be equal over time. On the basis of suggestions by Geiser (2011), we also specified an indicatorspecific effect for the second indicator (see Figure 1). This approach, in contrast to autocorrelating error variables of the same indicators (Cole & Maxwell, 2003; Lance, Noble, & Scullen, 2002), provides a way to statistically separate indicator-specific effects and error variance. The traditional correlated-uniqueness models (Lance et al., 2002), where errors of the same indicators are correlated, do not allow for this separation. Thus, error variance and indicator-specific effects remain confounded, which generally leads to an underestimation of the indicators (Eid, Schneider, & Schwenkmezger, 1999; see also Geiser, 2011, for details). We performed the analyses in three steps. First, we estimated level and change for global self-esteem and for the two self-esteem domains. In addition to average estimates, we were particularly interested in individual differences in level and change. Significant variance in level would indicate that individuals differ in their initial levels of self-esteem, whereas significant variance in change would suggest that adolescents differ in their developmental trajectory. Second, we examined gender effects on level and change in global and domain-specific self-esteem. Third, we investigated the predictive effects of level and change on depressive symptoms at age 16 and age 35 (see Figure 1). We included peer popularity as a time-varying covariate for global self-esteem, BMI as a time-varying covariate for perceived physical appearance, and school grades as a time-varying covariate for perceived academic competence (see Figure 1). Results Table 1 presents the means, standard deviations, and reliability estimates for the study variables. Table 2 includes the correlations between the three constructs and the test–retest correlations. The global self-esteem scale was moderately stable over time with correlations of .58 (age 12–13), .59 (age 13–14), .63 (age 14 –15), and .58 (age 15–16; all p .001). Test–retest correlations are only minimally lower to what is typically expected for global selfesteem in an adolescent sample (Trzesniewski et al., 2003). These slightly lower stability correlations may be due to the shorter version of the RSES used in this study; however, as research has shown, reasonable measures of self-esteem are even possible with a single item (Robins, Hendin, & Trzesniewski, 2001). The two self-esteem domains were moderately stable over time, both for the domain of academic competence (.52 [age 12–13], .58 [age 13– 14], .57 [age 14 –15] and .66 [age 15–16]) and for the domain of physical appearance (.52 [age 12–13], .65 [age 13–14], .69 [age 14 –15], and .74 [age 15–16]) (see Table 2). First, we estimated an LGM for each of the three constructs using five measurement points from age 12 to 16. Each model evidenced good fit: global self-esteem, 2 (39) 98.80, p .001, comparative fit index (CFI) .987, root-mean-square error of approximation (RMSEA) .032 (90% CI [.024, .040]); physical appearance, 2 (39) 89.52, p .001, CFI .988, RMSEA .029 (90% CI [.021, .037]); and academic compeTable 1 Descriptive Statistics and Reliability Estimates (KR-20) for Global Self-Esteem and Domain-Specific Self-Esteem T1: 12 years T2: 13 years T3: 14 years T4: 15 years T5: 16 years Variable M (SD) KR-20 M (SD) KR-20 M (SD) KR-20 M (SD) KR-20 M (SD) KR-20 Self-esteema 5.66 (1.97) .73 5.48 (2.12) .72 5.74 (2.10) .77 5.89 (2.09) .77 6.05 (2.02) .77 Physical appearanceb 3.78 (1.68) .65 3.87 (1.75) .69 4.03 (1.76) .72 4.07 (1.76) .72 4.18 (1.73) .72 Academic competenceb 4.22 (1.86) .77 4.33 (1.87) .79 4.63 (1.77) .80 4.69 (1.73) .79 4.82 (1.72) .82 Note. N 1,527. KR-20 Kuder-Richardson 20; T1–T5 Time 1–Time 5. a Scale ranged from 0 to 8. b Scale ranged from 0 to 6. This document is copyrighted by the American Psychological Association or one of its allied publishers. This article is intended solely for the personal use of the individual user and is not to be disseminated broadly. 330 STEIGER, ALLEMAND, ROBINS, AND FEND�����