正在加载图片...
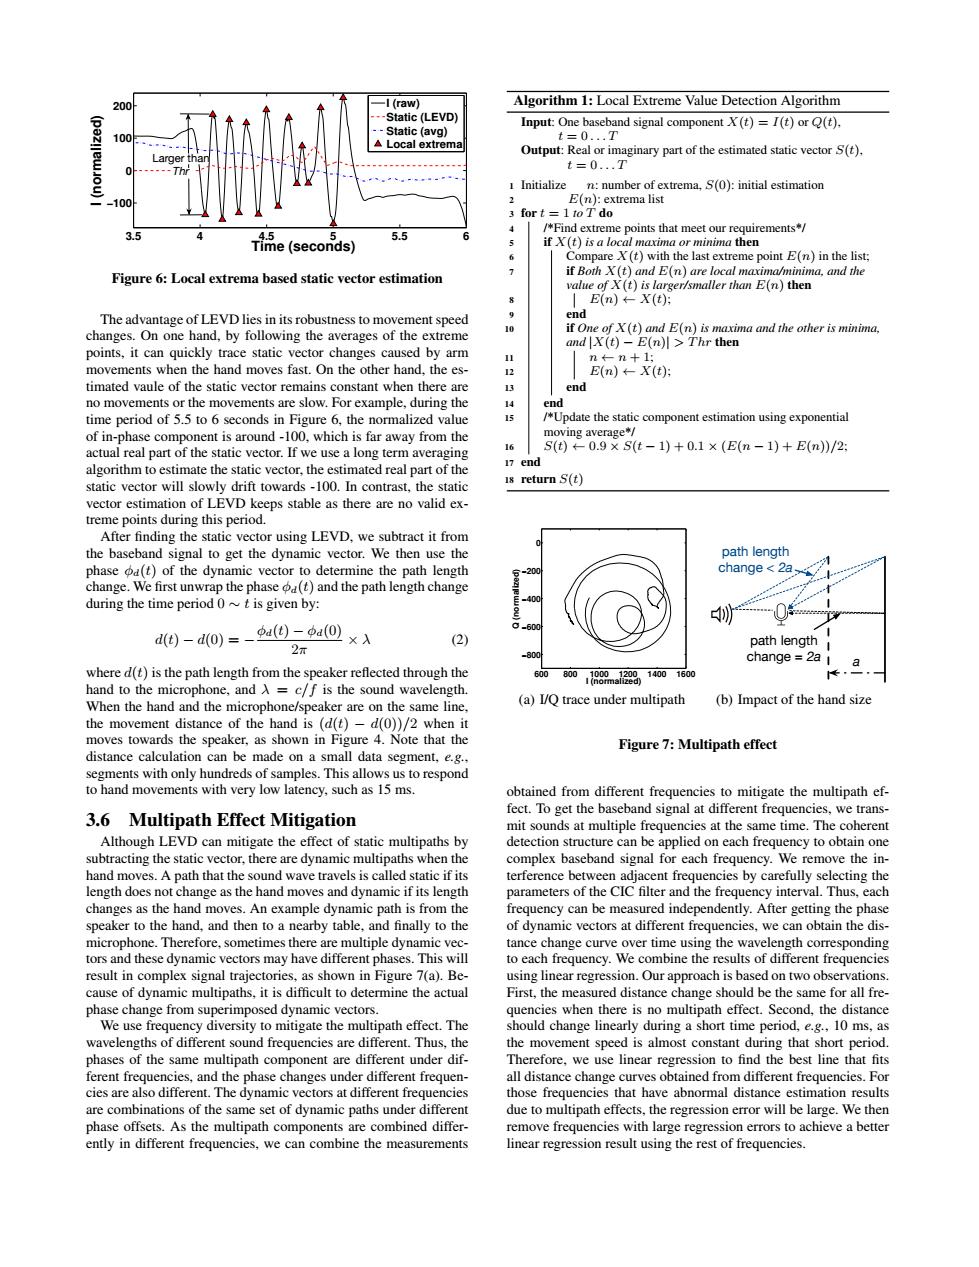
200 -I(raw) Algorithm 1:Local Extreme Value Detection Algorithm -Static (LEVD) Input:One baseband signal component X(t)=I(t)or Q(t) 100 Static(avg) ▲Local extrema t=0..T Output:Real or imaginary part of the estimated static vector S(t). Larger t Thr t=0...T 1 Initialize n:number of extrema,S(0):initial estimation 100 2 E(n):extrema list 3 fort=1toTdo /*Find extreme points that meet our requirements"/ 3.5 ti瓶e(seconds) 5.5 if X(t)is a local maxima or minima then Compare X(t)with the last extreme point E(n)in the list: Figure 6:Local extrema based static vector estimation if Both X(t)and E(n)are local maxima/minima,and the value of X(t)is larger/smaller than E(n)then E(n)←-X(t)月 The advantage of LEVD lies in its robustness to movement speed end if One of X(t)and E(n)is maxima and the other is minima. changes.On one hand,by following the averages of the extreme and X(t)-E(n)>Thr then points,it can quickly trace static vector changes caused by arm 1 n←-n+1; movements when the hand moves fast.On the other hand.the es- 12 E(n)←-X(t) timated vaule of the static vector remains constant when there are 3 end no movements or the movements are slow.For example,during the 14 end time period of 5.5 to 6 seconds in Figure 6,the normalized value /Update the static component estimation using exponential of in-phase component is around-100,which is far away from the moving average*/ 16 actual real part of the static vector.If we use a long term averaging S(t)-0.9×S(t-1)+0.1×(E(n-1)+E(n)/2 17 end algorithm to estimate the static vector,the estimated real part of the static vector will slowly drift towards-100.In contrast,the static s return S(t) vector estimation of LEVD keeps stable as there are no valid ex- treme points during this period. After finding the static vector using LEVD,we subtract it from the baseband signal to get the dynamic vector.We then use the path length phase od(t)of the dynamic vector to determine the path length 20 change 2a change.We first unwrap the phase oa(t)and the path length change during the time period 0~t is given by: d()-do)=-a(④-pa(0) ×入 (2) 2n path length where d(t)is the path length from the speaker reflected through the 500 80089nal2814o0 160 hand to the microphone,and A =c/f is the sound wavelength When the hand and the microphone/speaker are on the same line, (a)I/Q trace under multipath (b)Impact of the hand size the movement distance of the hand is (d(t)-d(0))/2 when it moves towards the speaker,as shown in Figure 4.Note that the Figure 7:Multipath effect distance calculation can be made on a small data segment,e.g.. segments with only hundreds of samples.This allows us to respond to hand movements with very low latency,such as 15 ms. obtained from different frequencies to mitigate the multipath ef- fect.To get the baseband signal at different frequencies,we trans- 3.6 Multipath Effect Mitigation mit sounds at multiple frequencies at the same time.The coherent Although LEVD can mitigate the effect of static multipaths by detection structure can be applied on each frequency to obtain one subtracting the static vector,there are dynamic multipaths when the complex baseband signal for each frequency.We remove the in- hand moves.A path that the sound wave travels is called static if its terference between adjacent frequencies by carefully selecting the length does not change as the hand moves and dynamic if its length parameters of the CIC filter and the frequency interval.Thus,each changes as the hand moves.An example dynamic path is from the frequency can be measured independently.After getting the phase speaker to the hand,and then to a nearby table,and finally to the of dynamic vectors at different frequencies,we can obtain the dis- microphone.Therefore,sometimes there are multiple dynamic vec- tance change curve over time using the wavelength corresponding tors and these dynamic vectors may have different phases.This will to each frequency.We combine the results of different frequencies result in complex signal trajectories,as shown in Figure 7(a).Be- using linear regression.Our approach is based on two observations. cause of dynamic multipaths,it is difficult to determine the actual First,the measured distance change should be the same for all fre- phase change from superimposed dynamic vectors. quencies when there is no multipath effect.Second,the distance We use frequency diversity to mitigate the multipath effect.The should change linearly during a short time period,e.g.,10 ms,as wavelengths of different sound frequencies are different.Thus,the the movement speed is almost constant during that short period. phases of the same multipath component are different under dif- Therefore,we use linear regression to find the best line that fits ferent frequencies,and the phase changes under different frequen- all distance change curves obtained from different frequencies.For cies are also different.The dynamic vectors at different frequencies those frequencies that have abnormal distance estimation results are combinations of the same set of dynamic paths under different due to multipath effects,the regression error will be large.We then phase offsets.As the multipath components are combined differ- remove frequencies with large regression errors to achieve a better ently in different frequencies,we can combine the measurements linear regression result using the rest of frequencies.3.5 4 4.5 5 5.5 6 −100 0 100 200 Time (seconds) I (normalized) I (raw) Static (LEVD) Static (avg) Local extrema Larger than Thr Figure 6: Local extrema based static vector estimation The advantage of LEVD lies in its robustness to movement speed changes. On one hand, by following the averages of the extreme points, it can quickly trace static vector changes caused by arm movements when the hand moves fast. On the other hand, the estimated vaule of the static vector remains constant when there are no movements or the movements are slow. For example, during the time period of 5.5 to 6 seconds in Figure 6, the normalized value of in-phase component is around -100, which is far away from the actual real part of the static vector. If we use a long term averaging algorithm to estimate the static vector, the estimated real part of the static vector will slowly drift towards -100. In contrast, the static vector estimation of LEVD keeps stable as there are no valid extreme points during this period. After finding the static vector using LEVD, we subtract it from the baseband signal to get the dynamic vector. We then use the phase φd(t) of the dynamic vector to determine the path length change. We first unwrap the phase φd(t) and the path length change during the time period 0 ∼ t is given by: d(t) − d(0) = − φd(t) − φd(0) 2π × λ (2) where d(t) is the path length from the speaker reflected through the hand to the microphone, and λ = c/f is the sound wavelength. When the hand and the microphone/speaker are on the same line, the movement distance of the hand is (d(t) − d(0))/2 when it moves towards the speaker, as shown in Figure 4. Note that the distance calculation can be made on a small data segment, e.g., segments with only hundreds of samples. This allows us to respond to hand movements with very low latency, such as 15 ms. 3.6 Multipath Effect Mitigation Although LEVD can mitigate the effect of static multipaths by subtracting the static vector, there are dynamic multipaths when the hand moves. A path that the sound wave travels is called static if its length does not change as the hand moves and dynamic if its length changes as the hand moves. An example dynamic path is from the speaker to the hand, and then to a nearby table, and finally to the microphone. Therefore, sometimes there are multiple dynamic vectors and these dynamic vectors may have different phases. This will result in complex signal trajectories, as shown in Figure 7(a). Because of dynamic multipaths, it is difficult to determine the actual phase change from superimposed dynamic vectors. We use frequency diversity to mitigate the multipath effect. The wavelengths of different sound frequencies are different. Thus, the phases of the same multipath component are different under different frequencies, and the phase changes under different frequencies are also different. The dynamic vectors at different frequencies are combinations of the same set of dynamic paths under different phase offsets. As the multipath components are combined differently in different frequencies, we can combine the measurements Algorithm 1: Local Extreme Value Detection Algorithm Input: One baseband signal component X(t) = I(t) or Q(t), t = 0 . . . T Output: Real or imaginary part of the estimated static vector S(t), t = 0 . . . T 1 Initialize n: number of extrema, S(0): initial estimation 2 E(n): extrema list 3 for t = 1 to T do 4 /*Find extreme points that meet our requirements*/ 5 if X(t) is a local maxima or minima then 6 Compare X(t) with the last extreme point E(n) in the list; 7 if Both X(t) and E(n) are local maxima/minima, and the value of X(t) is larger/smaller than E(n) then 8 E(n) ← X(t); 9 end 10 if One of X(t) and E(n) is maxima and the other is minima, and |X(t) − E(n)| > T hr then 11 n ← n + 1; 12 E(n) ← X(t); 13 end 14 end 15 /*Update the static component estimation using exponential moving average*/ 16 S(t) ← 0.9 × S(t − 1) + 0.1 × (E(n − 1) + E(n))/2; 17 end 18 return S(t) 600 800 1000 1200 1400 1600 −800 −600 −400 −200 0 I (normalized) Q (normalized) (a) I/Q trace under multipath a path length change = 2a path length change < 2a (b) Impact of the hand size Figure 7: Multipath effect obtained from different frequencies to mitigate the multipath effect. To get the baseband signal at different frequencies, we transmit sounds at multiple frequencies at the same time. The coherent detection structure can be applied on each frequency to obtain one complex baseband signal for each frequency. We remove the interference between adjacent frequencies by carefully selecting the parameters of the CIC filter and the frequency interval. Thus, each frequency can be measured independently. After getting the phase of dynamic vectors at different frequencies, we can obtain the distance change curve over time using the wavelength corresponding to each frequency. We combine the results of different frequencies using linear regression. Our approach is based on two observations. First, the measured distance change should be the same for all frequencies when there is no multipath effect. Second, the distance should change linearly during a short time period, e.g., 10 ms, as the movement speed is almost constant during that short period. Therefore, we use linear regression to find the best line that fits all distance change curves obtained from different frequencies. For those frequencies that have abnormal distance estimation results due to multipath effects, the regression error will be large. We then remove frequencies with large regression errors to achieve a better linear regression result using the rest of frequencies