正在加载图片...
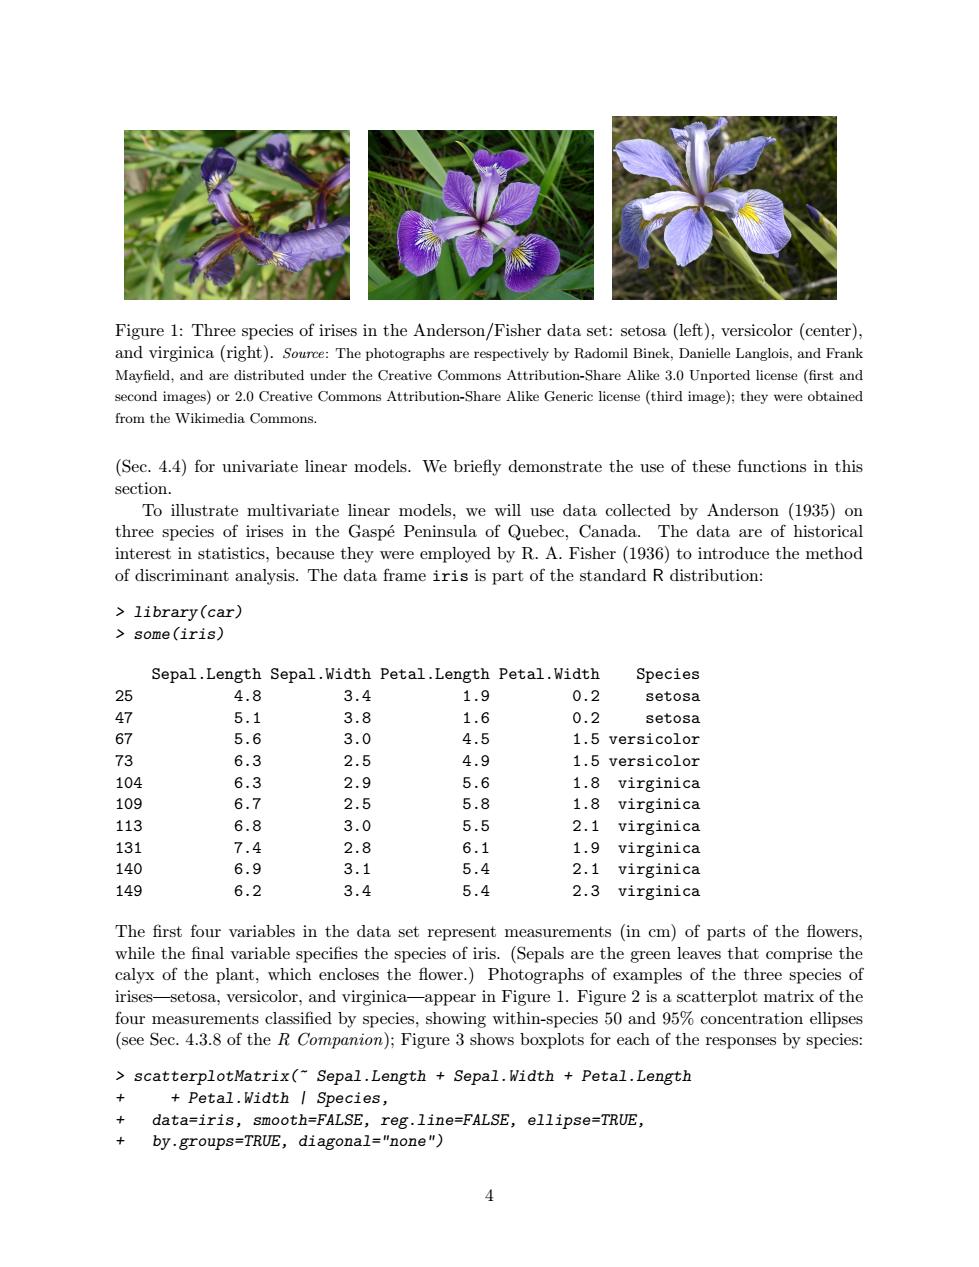
Figure 1:Three species of irises in the Anderson/Fisher data set:setosa (left),versicolor (center), and virginica(right).Source:The photographs are respectively by Radomil Binek,Danielle Langlois,and Frank Mayfield,and are distributed under the Creative Commons Attribution-Share Alike 3.0 Unported license (first and second images)or 2.0 Creative Commons Attribution-Share Alike Generic license (third image);they were obtained from the Wikimedia Commons. (Sec.4.4)for univariate linear models.We briefly demonstrate the use of these functions in this section. To illustrate multivariate linear models,we will use data collected by Anderson (1935)on three species of irises in the Gaspe Peninsula of Quebec,Canada.The data are of historical interest in statistics,because they were employed by R.A.Fisher (1936)to introduce the method of discriminant analysis.The data frame iris is part of the standard R distribution: library(car) some(iris) Sepal.Length Sepal.Width Petal.Length Petal.Width Species 25 4.8 3.4 1.9 0.2 setosa 47 5.1 3.8 1.6 0.2 setosa 67 5.6 3.0 4.5 1.5 versicolor 73 6.3 2.5 4.9 1.5 versicolor 104 6.3 2.9 5.6 1.8 virginica 109 6.7 2.5 5.8 1.8 virginica 113 6.8 3.0 5.5 2.1 virginica 131 7.4 2.8 6.1 1.9 virginica 140 6.9 3.1 5.4 2.1 virginica 149 6.2 3.4 5.4 2.3 virginica The first four variables in the data set represent measurements (in cm)of parts of the flowers, while the final variable specifies the species of iris.(Sepals are the green leaves that comprise the calyx of the plant,which encloses the flower.)Photographs of examples of the three species of irises-setosa,versicolor,and virginica-appear in Figure 1.Figure 2 is a scatterplot matrix of the four measurements classified by species,showing within-species 50 and 95%concentration ellipses (see Sec.4.3.8 of the R Companion);Figure 3 shows boxplots for each of the responses by species: scatterplotMatrix(Sepal.Length Sepal.Width Petal.Length Petal.Width I Species, + data=iris,smooth=FALSE,reg.line=FALSE,ellipse=TRUE, by.groups=TRUE,diagonal="none") 4Figure 1: Three species of irises in the Anderson/Fisher data set: setosa (left), versicolor (center), and virginica (right). Source: The photographs are respectively by Radomil Binek, Danielle Langlois, and Frank Mayfield, and are distributed under the Creative Commons Attribution-Share Alike 3.0 Unported license (first and second images) or 2.0 Creative Commons Attribution-Share Alike Generic license (third image); they were obtained from the Wikimedia Commons. (Sec. 4.4) for univariate linear models. We briefly demonstrate the use of these functions in this section. To illustrate multivariate linear models, we will use data collected by Anderson (1935) on three species of irises in the Gasp´e Peninsula of Quebec, Canada. The data are of historical interest in statistics, because they were employed by R. A. Fisher (1936) to introduce the method of discriminant analysis. The data frame iris is part of the standard R distribution: > library(car) > some(iris) Sepal.Length Sepal.Width Petal.Length Petal.Width Species 25 4.8 3.4 1.9 0.2 setosa 47 5.1 3.8 1.6 0.2 setosa 67 5.6 3.0 4.5 1.5 versicolor 73 6.3 2.5 4.9 1.5 versicolor 104 6.3 2.9 5.6 1.8 virginica 109 6.7 2.5 5.8 1.8 virginica 113 6.8 3.0 5.5 2.1 virginica 131 7.4 2.8 6.1 1.9 virginica 140 6.9 3.1 5.4 2.1 virginica 149 6.2 3.4 5.4 2.3 virginica The first four variables in the data set represent measurements (in cm) of parts of the flowers, while the final variable specifies the species of iris. (Sepals are the green leaves that comprise the calyx of the plant, which encloses the flower.) Photographs of examples of the three species of irises—setosa, versicolor, and virginica—appear in Figure 1. Figure 2 is a scatterplot matrix of the four measurements classified by species, showing within-species 50 and 95% concentration ellipses (see Sec. 4.3.8 of the R Companion); Figure 3 shows boxplots for each of the responses by species: > scatterplotMatrix(~ Sepal.Length + Sepal.Width + Petal.Length + + Petal.Width | Species, + data=iris, smooth=FALSE, reg.line=FALSE, ellipse=TRUE, + by.groups=TRUE, diagonal="none") 4