正在加载图片...

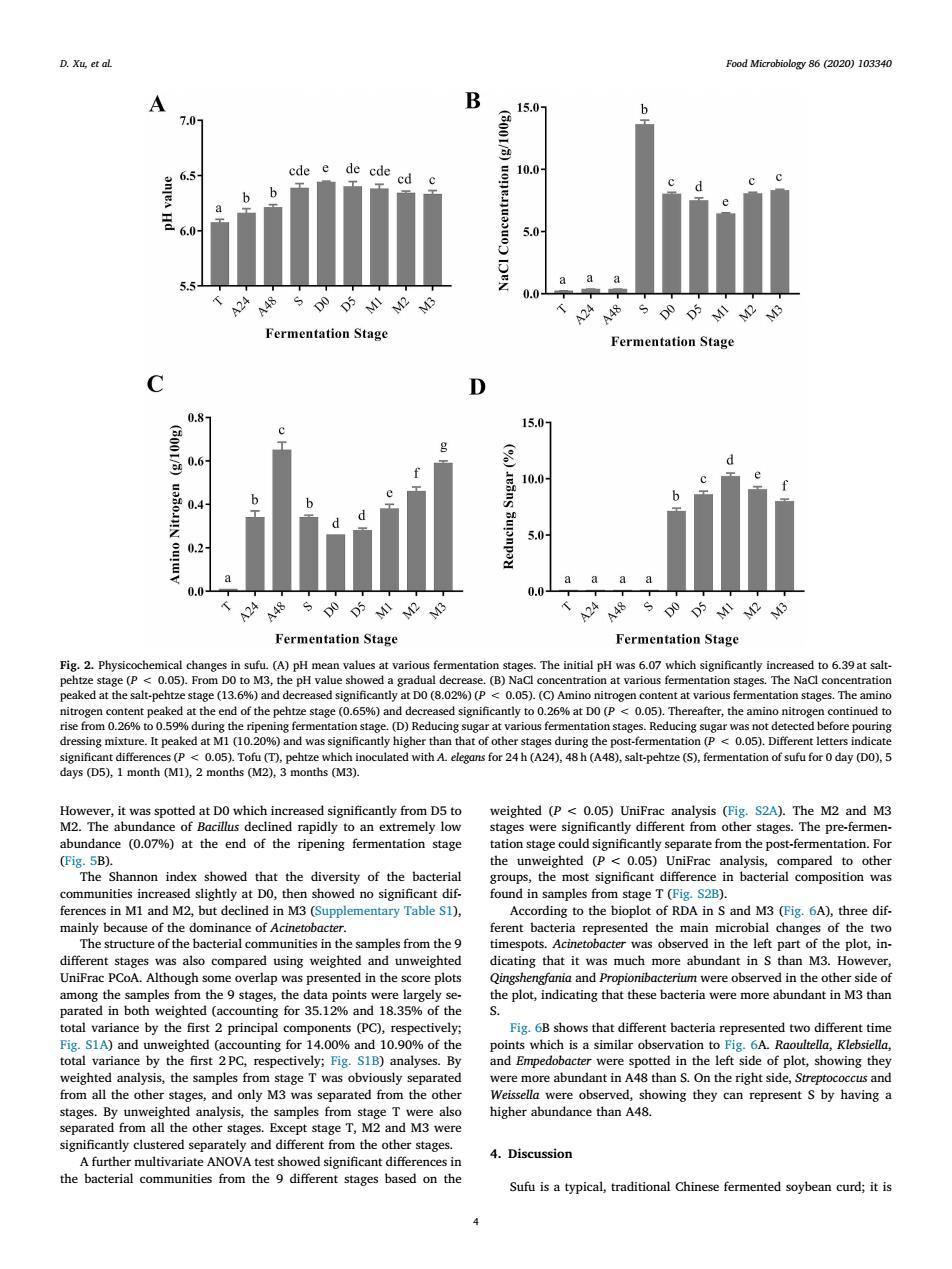
D.Xu et al Food Microbiology 86 (2020)103340 A 150 aa Fermentation Stage Fermentation Stage 0 0.4 5.0 aaaa 0.0 Fermentation Stage Fermentation Stage Fig.2.Phys 05)Do n values 0.65% fter,the ami It pe d was s到 <0.5).De M2.The ab weighted (P<0.05)UniFr sign ages.The pre- 0.0791 at h (Fig.5B) he othe index that the of the ha unities slightly g.S2B olementary Table S1). e of the d the bacterial commu the UniFrac PCoA. nted in the s ore plot ed n both weig ing for 512%and 18.3 of the S1A)and un different bacteria unting for 14.00% 1d10.90% of the n to ig sly sena xccus and he othe ated fro th owing they can represent s by having a the ot stage I and M3 and diff 4.Discussion furth test sho significant diffe Sufu is a typical,traditional Chine nted sovbean curd:it isHowever, it was spotted at D0 which increased significantly from D5 to M2. The abundance of Bacillus declined rapidly to an extremely low abundance (0.07%) at the end of the ripening fermentation stage (Fig. 5B). The Shannon index showed that the diversity of the bacterial communities increased slightly at D0, then showed no significant differences in M1 and M2, but declined in M3 (Supplementary Table S1), mainly because of the dominance of Acinetobacter. The structure of the bacterial communities in the samples from the 9 different stages was also compared using weighted and unweighted UniFrac PCoA. Although some overlap was presented in the score plots among the samples from the 9 stages, the data points were largely separated in both weighted (accounting for 35.12% and 18.35% of the total variance by the first 2 principal components (PC), respectively; Fig. S1A) and unweighted (accounting for 14.00% and 10.90% of the total variance by the first 2 PC, respectively; Fig. S1B) analyses. By weighted analysis, the samples from stage T was obviously separated from all the other stages, and only M3 was separated from the other stages. By unweighted analysis, the samples from stage T were also separated from all the other stages. Except stage T, M2 and M3 were significantly clustered separately and different from the other stages. A further multivariate ANOVA test showed significant differences in the bacterial communities from the 9 different stages based on the weighted (P < 0.05) UniFrac analysis (Fig. S2A). The M2 and M3 stages were significantly different from other stages. The pre-fermentation stage could significantly separate from the post-fermentation. For the unweighted (P < 0.05) UniFrac analysis, compared to other groups, the most significant difference in bacterial composition was found in samples from stage T (Fig. S2B). According to the bioplot of RDA in S and M3 (Fig. 6A), three different bacteria represented the main microbial changes of the two timespots. Acinetobacter was observed in the left part of the plot, indicating that it was much more abundant in S than M3. However, Qingshengfania and Propionibacterium were observed in the other side of the plot, indicating that these bacteria were more abundant in M3 than S. Fig. 6B shows that different bacteria represented two different time points which is a similar observation to Fig. 6A. Raoultella, Klebsiella, and Empedobacter were spotted in the left side of plot, showing they were more abundant in A48 than S. On the right side, Streptococcus and Weissella were observed, showing they can represent S by having a higher abundance than A48. 4. Discussion Sufu is a typical, traditional Chinese fermented soybean curd; it is Fig. 2. Physicochemical changes in sufu. (A) pH mean values at various fermentation stages. The initial pH was 6.07 which significantly increased to 6.39 at saltpehtze stage (P < 0.05). From D0 to M3, the pH value showed a gradual decrease. (B) NaCl concentration at various fermentation stages. The NaCl concentration peaked at the salt-pehtze stage (13.6%) and decreased significantly at D0 (8.02%) (P < 0.05). (C) Amino nitrogen content at various fermentation stages. The amino nitrogen content peaked at the end of the pehtze stage (0.65%) and decreased significantly to 0.26% at D0 (P < 0.05). Thereafter, the amino nitrogen continued to rise from 0.26% to 0.59% during the ripening fermentation stage. (D) Reducing sugar at various fermentation stages. Reducing sugar was not detected before pouring dressing mixture. It peaked at M1 (10.20%) and was significantly higher than that of other stages during the post-fermentation (P < 0.05). Different letters indicate significant differences (P < 0.05). Tofu (T), pehtze which inoculated with A. elegans for 24 h (A24), 48 h (A48), salt-pehtze (S), fermentation of sufu for 0 day (D0), 5 days (D5), 1 month (M1), 2 months (M2), 3 months (M3). D. Xu, et al. Food Microbiology 86 (2020) 103340 4