正在加载图片...

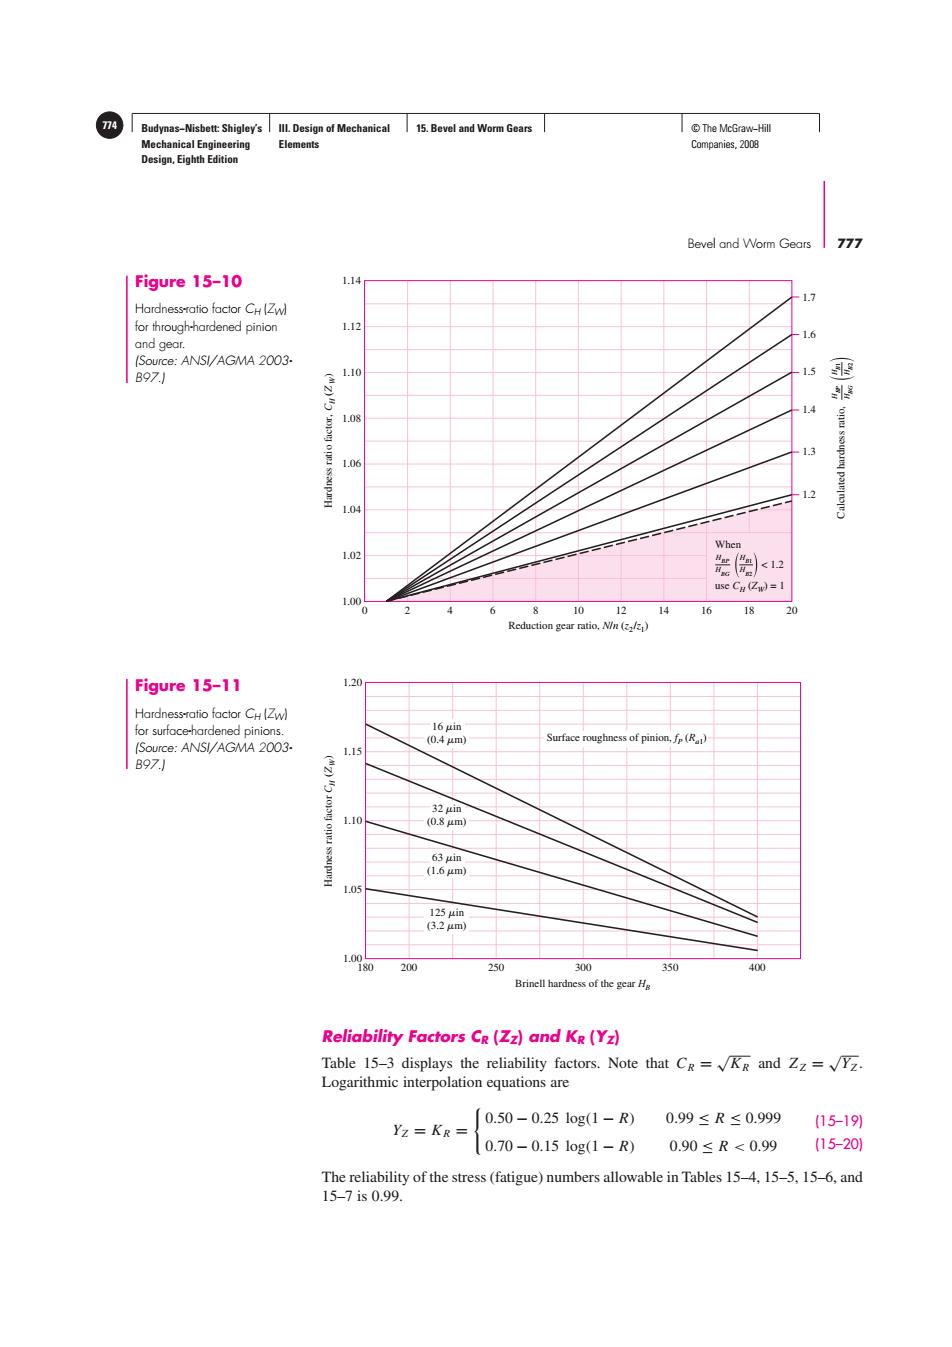
Budynas-Nisbett:Shigley's Ill.Design of Mechanical 15.Bevel and Worm Gears ©The McGraw-Hil Mechanical Engineering Elements Companies,2008 Design,Eighth Edition Bevel and Worm Gears 777 Figure 15-10 1.14 Hardness-tatio factor CHZw) for through-hardened pinion 1.12 1.6 and gear. (Source:ANSI/AGMA 2003- B971 1.10 1.5 g 1.4 1.08 1.3 1.06 12 1.04 When 1.02 是会<2 usc CH(亿=1 100 0 6 8 10 12 16 18 20 Reduction gear ratio,NIn ( Figure 15-11 1.20 Hardness-ratio factor CH[Zw) for surface-hardened pinions. 164in (0.44m) Surface roughness of pinion,fp(R) (Source:ANSI/AGMA 2003- 1.15 B97) 32 uin 1.10 (0.8μm) 63 uin (1.64m) 1.05 125μin (324m) 1.0980200 250 300 350 400 Brinell hardness of the gear He Reliability Factors CR(Zz)and Ke(Yz) Table 15-3 displays the reliability factors.Note that Cg=KR and Zz=YZ Logarithmic interpolation equations are 0.50-0.251og(1-R)0.99≤R≤0.999 (15-19) Yz=KR= 0.70-0.151og(1-R) 0.90≤R<0.99 (15-20 The reliability of the stress(fatigue)numbers allowable in Tables 15-4,15-5,15-6,and 15-7is0.99Budynas−Nisbett: Shigley’s Mechanical Engineering Design, Eighth Edition III. Design of Mechanical Elements 15. Bevel and Worm Gears 774 © The McGraw−Hill Companies, 2008 Bevel and Worm Gears 777 Hardness ratio factor, CH (Z W) Reduction gear ratio, N/n (z2/z1) 0 2 4 6 8 10 12 14 16 18 20 1.00 1.02 1.04 1.06 1.08 1.10 1.12 1.14 1.7 1.6 1.5 1.4 1.3 1.2 Calculated hardness ratio, HBG HBP HB2 HB1 < 1.2 When use CH (ZW) = 1 HBG HBP HB2 HB1 Figure 15–10 Hardness-ratio factor CH (ZW) for through-hardened pinion and gear. (Source: ANSI/AGMA 2003- B97.) Hardness ratio factor CH (Z W) Brinell hardness of the gear HB 180 200 250 300 350 400 1.00 1.05 1.10 1.15 1.20 16 in (0.4 m) Surface roughness of pinion, f P (Ra1) 32 in (0.8 m) 63 in (1.6 m) 125 in (3.2 m) Figure 15–11 Hardness-ratio factor CH (ZW) for surface-hardened pinions. (Source: ANSI/AGMA 2003- B97.) Reliability Factors CR (ZZ) and KR (YZ) Table 15–3 displays the reliability factors. Note that CR = √KR and ZZ = √YZ . Logarithmic interpolation equations are YZ = KR = 0.50 − 0.25 log(1 − R) 0.99 ≤ R ≤ 0.999 0.70 − 0.15 log(1 − R) 0.90 ≤ R < 0.99 (15–19) (15–20) The reliability of the stress (fatigue) numbers allowable in Tables 15–4, 15–5, 15–6, and 15–7 is 0.99.��������