正在加载图片...
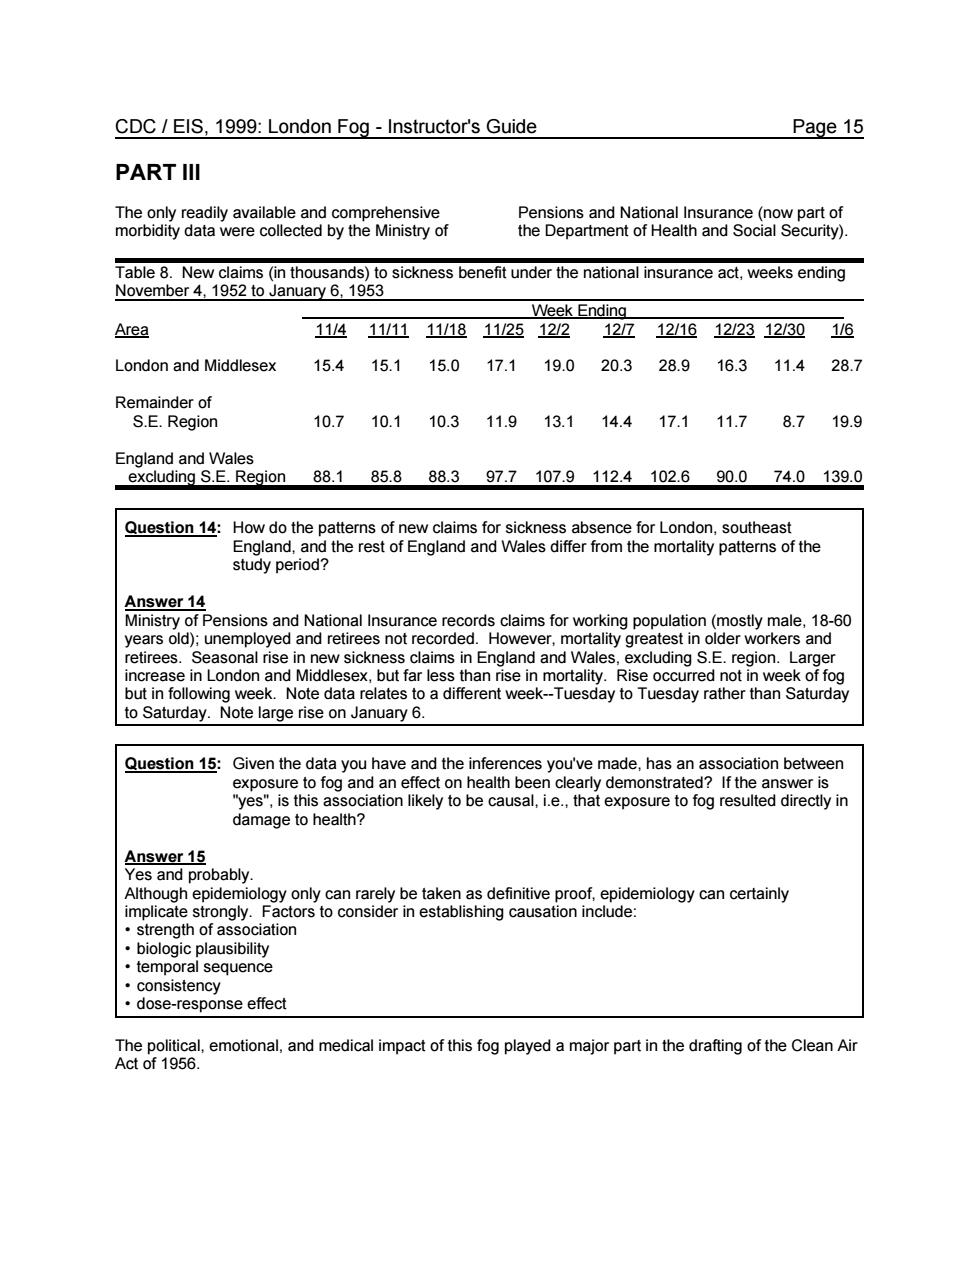
CDC/EIS,1999:London Fog-Instructor's Guide Page 15 PART III Table 8.New claims(in thousands)to sickness benefit under the national insurance act.weeks ending November 4.1952 to January 6.1953 Area 业器置22 London and Middlesex15.415.115.017.119.020.328.916.311.428.7 Remainder of S.E.Region 10.710.110.311.913.114.417.111.78.719.9 Eg8dSMa62on88185883g77107912410269n0740130 Question 14:How do the patterns of new claims for sickness absence for London.southeast Answer 14 e.18-60 retirees.Seasonal rise in new sickness claims in England and Wales,excluding S.E.region.Larger but in fo。nLondc tesoameaenekmoiesvR not t to Saturday.Note large rise on January 6. Question 15:Given the data you have and the inferences you've made,has an association between damage to health? gth of ciation biologic plausibility temporal sequence .dose-response effect The political,emotional.and medical impact of this fog played a major part in the drafting of the Clean Air Act of 1956. CDC / EIS, 1999: London Fog - Instructor's Guide Page 15 PART III The only readily available and comprehensive morbidity data were collected by the Ministry of Pensions and National Insurance (now part of the Department of Health and Social Security). Table 8. New claims (in thousands) to sickness benefit under the national insurance act, weeks ending November 4, 1952 to January 6, 1953 Week Ending Area 11/4 11/11 11/18 11/25 12/2 12/7 12/16 12/23 12/30 1/6 London and Middlesex 15.4 15.1 15.0 17.1 19.0 20.3 28.9 16.3 11.4 28.7 Remainder of S.E. Region 10.7 10.1 10.3 11.9 13.1 14.4 17.1 11.7 8.7 19.9 England and Wales excluding S.E. Region 88.1 85.8 88.3 97.7 107.9 112.4 102.6 90.0 74.0 139.0 Question 14: How do the patterns of new claims for sickness absence for London, southeast England, and the rest of England and Wales differ from the mortality patterns of the study period? Answer 14 Ministry of Pensions and National Insurance records claims for working population (mostly male, 18-60 years old); unemployed and retirees not recorded. However, mortality greatest in older workers and retirees. Seasonal rise in new sickness claims in England and Wales, excluding S.E. region. Larger increase in London and Middlesex, but far less than rise in mortality. Rise occurred not in week of fog but in following week. Note data relates to a different week-Tuesday to Tuesday rather than Saturday to Saturday. Note large rise on January 6. Question 15: Given the data you have and the inferences you've made, has an association between exposure to fog and an effect on health been clearly demonstrated? If the answer is "yes", is this association likely to be causal, i.e., that exposure to fog resulted directly in damage to health? Answer 15 Yes and probably. Although epidemiology only can rarely be taken as definitive proof, epidemiology can certainly implicate strongly. Factors to consider in establishing causation include: • strength of association • biologic plausibility • temporal sequence • consistency • dose-response effect The political, emotional, and medical impact of this fog played a major part in the drafting of the Clean Air Act of 1956