正在加载图片...

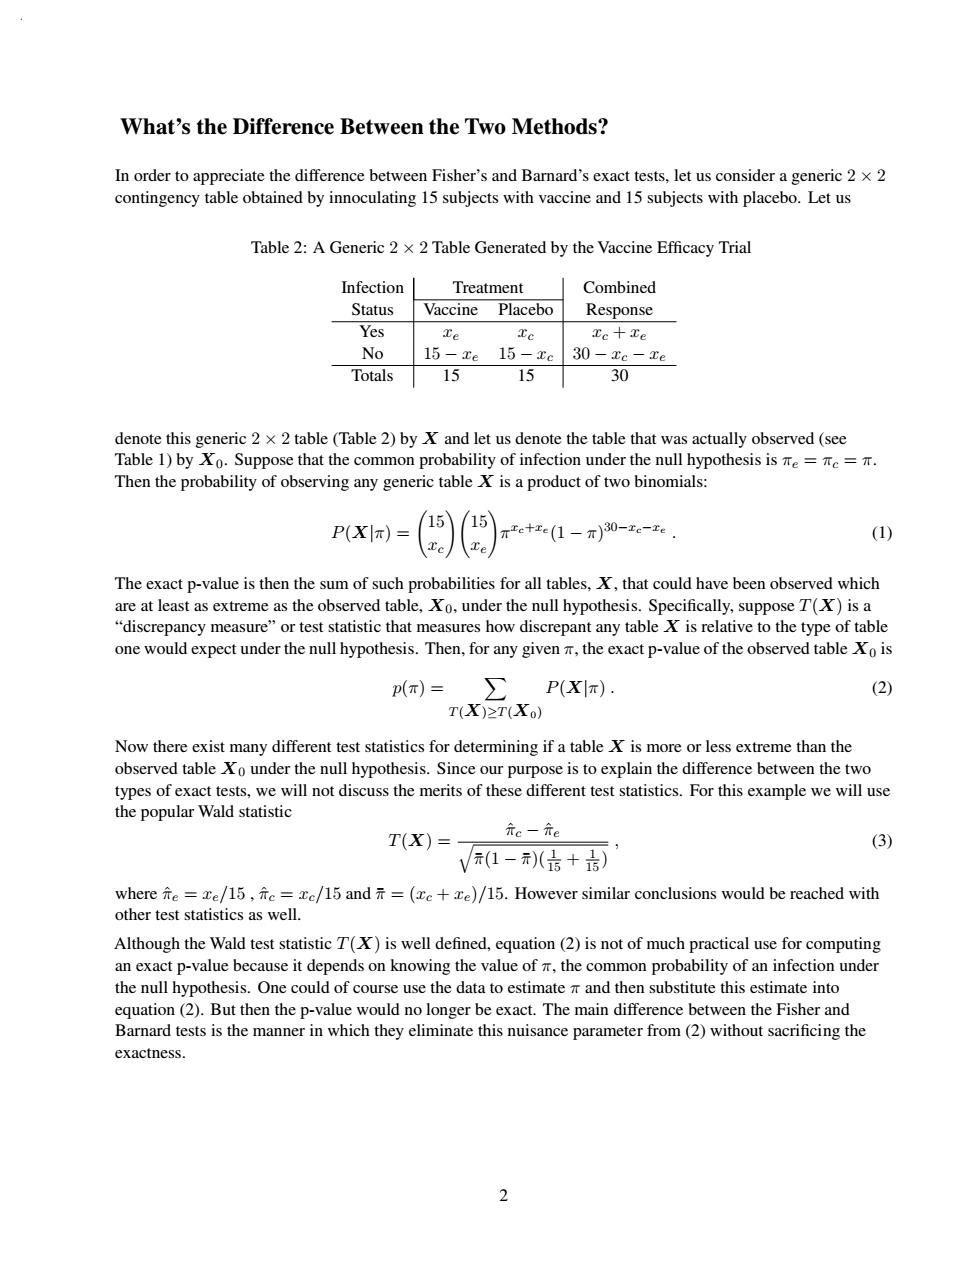
What's the Difference Between the Two Methods? In order to appreciate the difference between Fisher's and Barnard's exact tests,let us consider a generic 2 x 2 contingency table obtained by innoculating 15 subjects with vaccine and 15 subjects with placebo.Let us Table 2:A Generic 2 x 2 Table Generated by the Vaccine Efficacy Trial Infection Treatment Combined Status Vaccine Placebo Response Yes Te Te Tc+Te No 15-xe15-xc 30-Zc-Ze Totals 15 15 30 denote this generic 2 x 2 table (Table 2)by X and let us denote the table that was actually observed (see Table 1)by Xo.Suppose that the common probability of infection under the null hypothesis is Te=Te=T. Then the probability of observing any generic table X is a product of two binomials: P(X|π)= 1515 πre+c(1-π)30-xe-xe. (1) Te The exact p-value is then the sum of such probabilities for all tables,X,that could have been observed which are at least as extreme as the observed table,Xo,under the null hypothesis.Specifically,suppose T(X)is a "discrepancy measure"or test statistic that measures how discrepant any table X is relative to the type of table one would expect under the null hypothesis.Then,for any given the exact p-value of the observed table Xo is p(x)= ∑P(xI): (2) T(X)≥T(X) Now there exist many different test statistics for determining if a table X is more or less extreme than the observed table Xo under the null hypothesis.Since our purpose is to explain the difference between the two types of exact tests,we will not discuss the merits of these different test statistics.For this example we will use the popular Wald statistic T(X)= 分c一元e (3) √(1-元)(品+) where fe xe/15,fe=c/15 and=(ze+xe)/15.However similar conclusions would be reached with other test statistics as well. Although the Wald test statistic T(X)is well defined,equation(2)is not of much practical use for computing an exact p-value because it depends on knowing the value of the common probability of an infection under the null hypothesis.One could of course use the data to estimate and then substitute this estimate into equation(2).But then the p-value would no longer be exact.The main difference between the Fisher and Barnard tests is the manner in which they eliminate this nuisance parameter from(2)without sacrificing the exactness. 2What’s the Difference Between the Two Methods? In order to appreciate the difference between Fisher’s and Barnard’s exact tests, let us consider a generic 2 × 2 contingency table obtained by innoculating 15 subjects with vaccine and 15 subjects with placebo. Let us Table 2: A Generic 2 × 2 Table Generated by the Vaccine Efficacy Trial Infection Treatment Combined Status Vaccine Placebo Response Yes xe xc xc + xe No 15 − xe 15 − xc 30 − xc − xe Totals 15 15 30 denote this generic 2 × 2 table (Table 2) by X and let us denote the table that was actually observed (see Table 1) by X0. Suppose that the common probability of infection under the null hypothesis is πe = πc = π. Then the probability of observing any generic table X is a product of two binomials: P(X|π) = 15 xc 15 xe πxc+xe (1 − π) 30−xc−xe . (1) The exact p-value is then the sum of such probabilities for all tables, X, that could have been observed which are at least as extreme as the observed table, X0, under the null hypothesis. Specifically, suppose T(X) is a “discrepancy measure” or test statistic that measures how discrepant any table X is relative to the type of table one would expect under the null hypothesis. Then, for any given π, the exact p-value of the observed table X0 is p(π) = T (X)≥T(X0) P(X|π) . (2) Now there exist many different test statistics for determining if a table X is more or less extreme than the observed table X0 under the null hypothesis. Since our purpose is to explain the difference between the two types of exact tests, we will not discuss the merits of these different test statistics. For this example we will use the popular Wald statistic T(X) = πˆc − πˆe π¯(1 − π¯)( 1 15 + 1 15 ) , (3) where πˆe = xe/15 , πˆc = xc/15 and π¯ = (xc + xe)/15. However similar conclusions would be reached with other test statistics as well. Although the Wald test statistic T(X) is well defined, equation (2) is not of much practical use for computing an exact p-value because it depends on knowing the value of π, the common probability of an infection under the null hypothesis. One could of course use the data to estimate π and then substitute this estimate into equation (2). But then the p-value would no longer be exact. The main difference between the Fisher and Barnard tests is the manner in which they eliminate this nuisance parameter from (2) without sacrificing the exactness. 2���