正在加载图片...
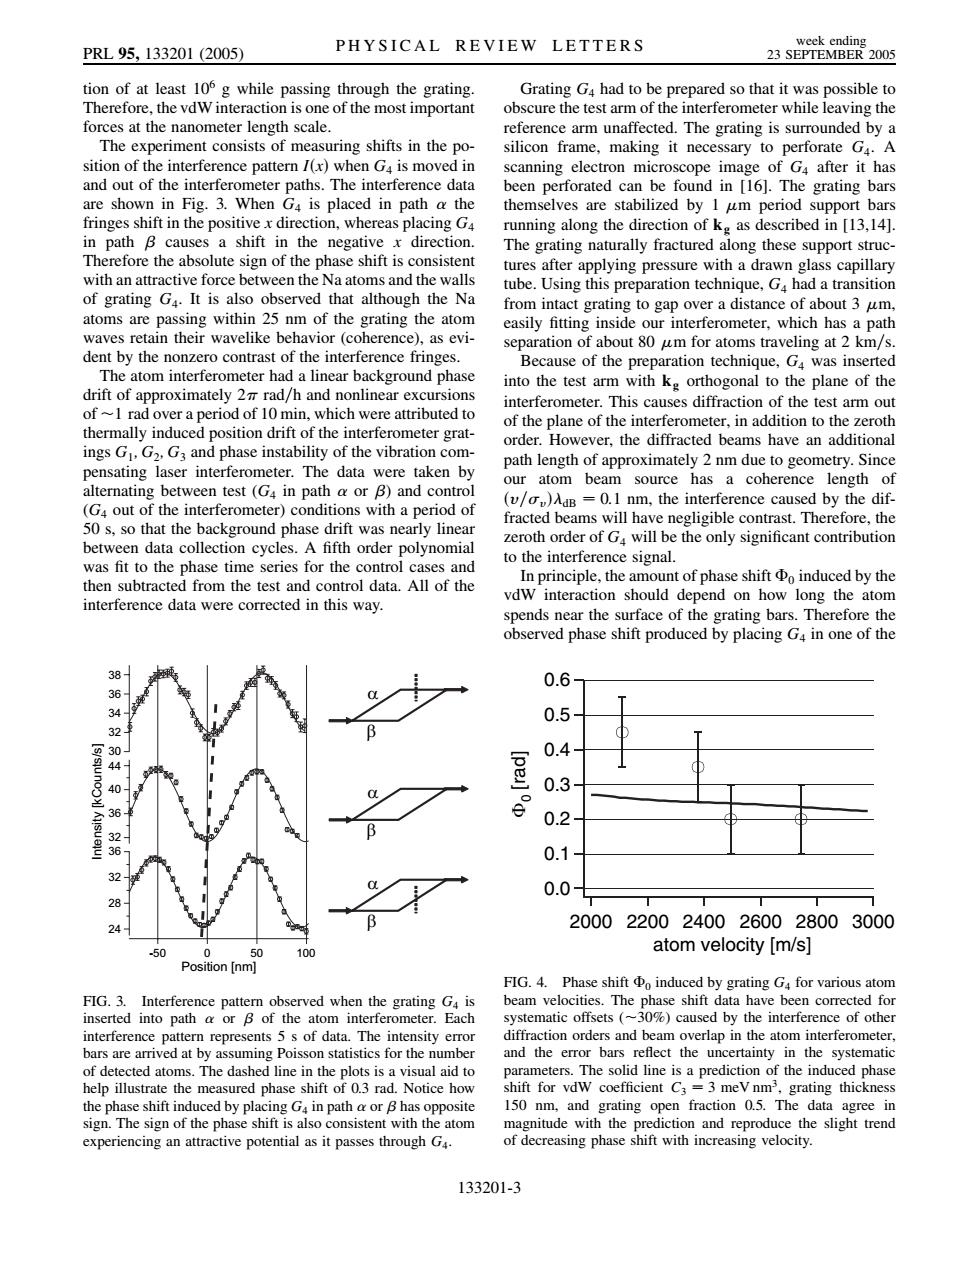
week ending PRL95,133201(2005) PHYSICAL REVIEW LETTERS 23 SEPTEMBER 2005 tion of at least 106 g while passing through the grating. Grating G4 had to be prepared so that it was possible to Therefore,the vdW interaction is one of the most important obscure the test arm of the interferometer while leaving the forces at the nanometer length scale. reference arm unaffected.The grating is surrounded by a The experiment consists of measuring shifts in the po- silicon frame,making it necessary to perforate G4.A sition of the interference pattern I(x)when Ga is moved in scanning electron microscope image of G4 after it has and out of the interferometer paths.The interference data been perforated can be found in [16].The grating bars are shown in Fig.3.When G4 is placed in path a the themselves are stabilized by 1 um period support bars fringes shift in the positive x direction,whereas placing G4 running along the direction of k as described in [13,14]. in path B causes a shift in the negative x direction. The grating naturally fractured along these support struc- Therefore the absolute sign of the phase shift is consistent tures after applying pressure with a drawn glass capillary with an attractive force between the Na atoms and the walls tube.Using this preparation technique,G4 had a transition of grating G4.It is also observed that although the Na from intact grating to gap over a distance of about 3 um, atoms are passing within 25 nm of the grating the atom easily fitting inside our interferometer,which has a path waves retain their wavelike behavior (coherence),as evi- separation of about 80 um for atoms traveling at 2 km/s. dent by the nonzero contrast of the interference fringes. Because of the preparation technique,G4 was inserted The atom interferometer had a linear background phase into the test arm with kg orthogonal to the plane of the drift of approximately 2 rad/h and nonlinear excursions interferometer.This causes diffraction of the test arm out of ~1 rad over a period of 10 min,which were attributed to of the plane of the interferometer,in addition to the zeroth thermally induced position drift of the interferometer grat- order.However,the diffracted beams have an additional ings G,G2.G3 and phase instability of the vibration com- path length of approximately 2 nm due to geometry.Since pensating laser interferometer.The data were taken by our atom beam source has a coherence length of alternating between test (G4 in path a or B)and control (v/o)AaB =0.1 nm,the interference caused by the dif- (G4 out of the interferometer)conditions with a period of fracted beams will have negligible contrast.Therefore,the 50 s,so that the background phase drift was nearly linear between data collection cycles.A fifth order polynomial zeroth order of Ga will be the only significant contribution was fit to the phase time series for the control cases and to the interference signal. then subtracted from the test and control data.All of the In principle.the amount of phase shift o induced by the interference data were corrected in this way. vdw interaction should depend on how long the atom spends near the surface of the grating bars.Therefore the observed phase shift produced by placing G4 in one of the 0.6 36 34 0.5 0 0.4- 8 云 40 0.3 36 0.2 32 3 0.1 32 0.0 28 200022002400260028003000 24 50 50 100 atom velocity [m/s] Position [nm] FIG.4.Phase shift o induced by grating G4 for various atom FIG.3.Interference pattern observed when the grating G4 is beam velocities.The phase shift data have been corrected for inserted into path a or B of the atom interferometer.Each systematic offsets(~30%)caused by the interference of other interference pattern represents 5 s of data.The intensity error diffraction orders and beam overlap in the atom interferometer. bars are arrived at by assuming Poisson statistics for the number and the error bars reflect the uncertainty in the systematic of detected atoms.The dashed line in the plots is a visual aid to parameters.The solid line is a prediction of the induced phase help illustrate the measured phase shift of 0.3 rad.Notice how shift for vdw coefficient C3=3 meV nm3,grating thickness the phase shift induced by placing Ga in path a or B has opposite 150 nm,and grating open fraction 0.5.The data agree in sign.The sign of the phase shift is also consistent with the atom magnitude with the prediction and reproduce the slight trend experiencing an attractive potential as it passes through G4 of decreasing phase shift with increasing velocity. 133201-3tion of at least 106 g while passing through the grating. Therefore, the vdW interaction is one of the most important forces at the nanometer length scale. The experiment consists of measuring shifts in the position of the interference pattern Ix when G4 is moved in and out of the interferometer paths. The interference data are shown in Fig. 3. When G4 is placed in path the fringes shift in the positive x direction, whereas placing G4 in path causes a shift in the negative x direction. Therefore the absolute sign of the phase shift is consistent with an attractive force between the Na atoms and the walls of grating G4. It is also observed that although the Na atoms are passing within 25 nm of the grating the atom waves retain their wavelike behavior (coherence), as evident by the nonzero contrast of the interference fringes. The atom interferometer had a linear background phase drift of approximately 2 rad=h and nonlinear excursions of 1 rad over a period of 10 min, which were attributed to thermally induced position drift of the interferometer gratings G1; G2; G3 and phase instability of the vibration compensating laser interferometer. The data were taken by alternating between test (G4 in path or ) and control (G4 out of the interferometer) conditions with a period of 50 s, so that the background phase drift was nearly linear between data collection cycles. A fifth order polynomial was fit to the phase time series for the control cases and then subtracted from the test and control data. All of the interference data were corrected in this way. Grating G4 had to be prepared so that it was possible to obscure the test arm of the interferometer while leaving the reference arm unaffected. The grating is surrounded by a silicon frame, making it necessary to perforate G4. A scanning electron microscope image of G4 after it has been perforated can be found in [16]. The grating bars themselves are stabilized by 1 m period support bars running along the direction of kg as described in [13,14]. The grating naturally fractured along these support structures after applying pressure with a drawn glass capillary tube. Using this preparation technique, G4 had a transition from intact grating to gap over a distance of about 3 m, easily fitting inside our interferometer, which has a path separation of about 80 m for atoms traveling at 2 km=s. Because of the preparation technique, G4 was inserted into the test arm with kg orthogonal to the plane of the interferometer. This causes diffraction of the test arm out of the plane of the interferometer, in addition to the zeroth order. However, the diffracted beams have an additional path length of approximately 2 nm due to geometry. Since our atom beam source has a coherence length of v= vdB 0:1 nm, the interference caused by the diffracted beams will have negligible contrast. Therefore, the zeroth order of G4 will be the only significant contribution to the interference signal. In principle, the amount of phase shift 0 induced by the vdW interaction should depend on how long the atom spends near the surface of the grating bars. Therefore the observed phase shift produced by placing G4 in one of the 36 32 28 24 -50 0 50 100 Position [nm] 44 40 36 32 Intensity [kCounts/s] 38 36 34 32 30 α β α α β β FIG. 3. Interference pattern observed when the grating G4 is inserted into path or of the atom interferometer. Each interference pattern represents 5 s of data. The intensity error bars are arrived at by assuming Poisson statistics for the number of detected atoms. The dashed line in the plots is a visual aid to help illustrate the measured phase shift of 0.3 rad. Notice how the phase shift induced by placing G4 in path or has opposite sign. The sign of the phase shift is also consistent with the atom experiencing an attractive potential as it passes through G4. 0.6 0.5 0.4 0.3 0.2 0.1 0.0 Φ0 [rad] 2000 2200 2400 2600 2800 3000 atom velocity [m/s] FIG. 4. Phase shift 0 induced by grating G4 for various atom beam velocities. The phase shift data have been corrected for systematic offsets (30%) caused by the interference of other diffraction orders and beam overlap in the atom interferometer, and the error bars reflect the uncertainty in the systematic parameters. The solid line is a prediction of the induced phase shift for vdW coefficient C3 3 meV nm3, grating thickness 150 nm, and grating open fraction 0.5. The data agree in magnitude with the prediction and reproduce the slight trend of decreasing phase shift with increasing velocity. PRL 95, 133201 (2005) PHYSICAL REVIEW LETTERS week ending 23 SEPTEMBER 2005 133201-3����