正在加载图片...
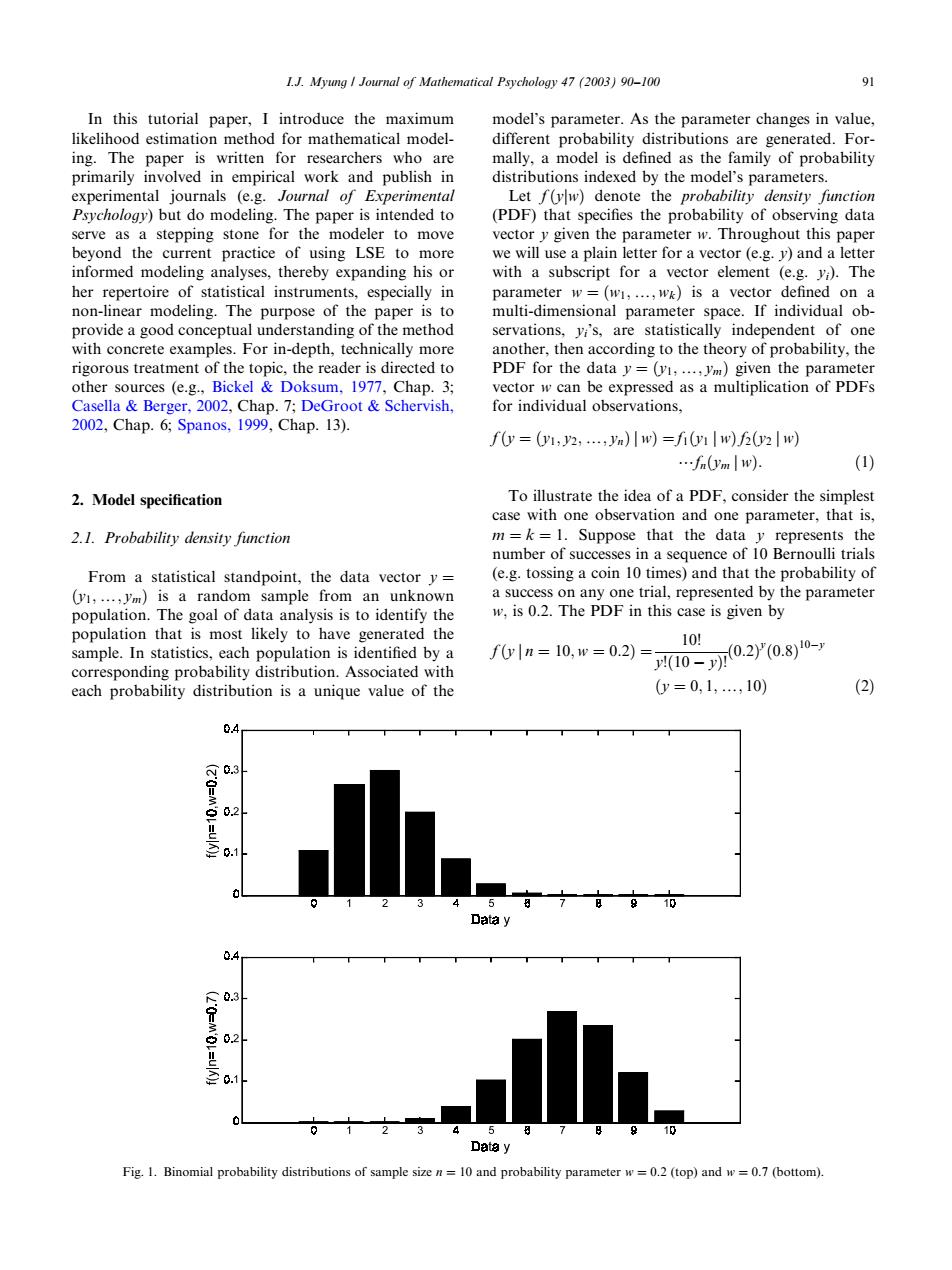
I.J.Myung Journal of Mathematical Psychology 47 (2003)90-100 91 In this tutorial paper,I introduce the maximum model's parameter.As the parameter changes in value, likelihood estimation method for mathematical model- different probability distributions are generated.For- ing.The paper is written for researchers who are mally,a model is defined as the family of probability primarily involved in empirical work and publish in distributions indexed by the model's parameters. experimental journals (e.g.Journal of Experimental Let f(yw)denote the probability density function Psychology)but do modeling.The paper is intended to (PDF)that specifies the probability of observing data serve as a stepping stone for the modeler to move vector y given the parameter w.Throughout this paper beyond the current practice of using LSE to more we will use a plain letter for a vector (e.g.y)and a letter informed modeling analyses,thereby expanding his or with a subscript for a vector element (e.g.y).The her repertoire of statistical instruments,especially in parameter w=(w1,...,wk)is a vector defined on a non-linear modeling.The purpose of the paper is to multi-dimensional parameter space.If individual ob- provide a good conceptual understanding of the method servations,yi's,are statistically independent of one with concrete examples.For in-depth,technically more another,then according to the theory of probability,the rigorous treatment of the topic,the reader is directed to PDF for the data y=(v1,...,ym)given the parameter other sources (e.g.,Bickel Doksum,1977,Chap.3; vector w can be expressed as a multiplication of PDFs Casella Berger,2002,Chap.7;DeGroot Schervish, for individual observations, 2002,Chap.6;Spanos,1999,Chap.13). f(y=(vI,y2,...,yn)w)=fi(vw)f(v2w) …f(ym w) (1) 2.Model specification To illustrate the idea of a PDF,consider the simplest case with one observation and one parameter,that is, 2.1.Probability density function m=k=1.Suppose that the data y represents the number of successes in a sequence of 10 Bernoulli trials From a statistical standpoint,the data vector y= (e.g.tossing a coin 10 times)and that the probability of (y1,...,ym)is a random sample from an unknown a success on any one trial,represented by the parameter population.The goal of data analysis is to identify the w,is 0.2.The PDF in this case is given by population that is most likely to have generated the 10-n0.2y0.80- 101 sample.In statistics,each population is identified by a f0yln=10,w=0.2)= corresponding probability distribution.Associated with each probability distribution is a unique value of the 0y=0,1,,10) (2) 04 .3 0.2 Data y 0.4 0.3 0.2 1 Data y Fig.1.Binomial probability distributions of sample size n=10 and probability parameter w=0.2 (top)and w=0.7 (bottom)In this tutorial paper, I introduce the maximum likelihood estimation method for mathematical modeling. The paper is written for researchers who are primarily involved in empirical workand publish in experimental journals (e.g. Journal of Experimental Psychology) but do modeling. The paper is intended to serve as a stepping stone for the modeler to move beyond the current practice of using LSE to more informed modeling analyses, thereby expanding his or her repertoire of statistical instruments, especially in non-linear modeling. The purpose of the paper is to provide a good conceptual understanding of the method with concrete examples. For in-depth, technically more rigorous treatment of the topic, the reader is directed to other sources (e.g., Bickel & Doksum, 1977, Chap. 3; Casella & Berger, 2002, Chap. 7; DeGroot & Schervish, 2002, Chap. 6; Spanos, 1999, Chap. 13). 2. Model specification 2.1. Probability density function From a statistical standpoint, the data vector y ¼ ðy1;y; ymÞ is a random sample from an unknown population. The goal of data analysis is to identify the population that is most likely to have generated the sample. In statistics, each population is identified by a corresponding probability distribution. Associated with each probability distribution is a unique value of the model’s parameter. As the parameter changes in value, different probability distributions are generated. Formally, a model is defined as the family of probability distributions indexed by the model’s parameters. Let fðyjwÞ denote the probability density function (PDF) that specifies the probability of observing data vector y given the parameter w: Throughout this paper we will use a plain letter for a vector (e.g. y) and a letter with a subscript for a vector element (e.g. yi). The parameter w ¼ ðw1;y; wkÞ is a vector defined on a multi-dimensional parameter space. If individual observations, yi’s, are statistically independent of one another, then according to the theory of probability, the PDF for the data y ¼ ðy1;y; ymÞ given the parameter vector w can be expressed as a multiplication of PDFs for individual observations, fðy ¼ ðy1; y2;y; ynÞ j wÞ ¼ f1ðy1 j wÞ f2ðy2 j wÞ ?fnðym j wÞ: ð1Þ To illustrate the idea of a PDF, consider the simplest case with one observation and one parameter, that is, m ¼ k ¼ 1: Suppose that the data y represents the number of successes in a sequence of 10 Bernoulli trials (e.g. tossing a coin 10 times) and that the probability of a success on any one trial, represented by the parameter w; is 0.2. The PDF in this case is given by fðy j n ¼ 10; w ¼ 0:2Þ ¼ 10! y!ð10 yÞ! ð0:2Þ y ð0:8Þ 10y ðy ¼ 0; 1;y; 10Þ ð2Þ Fig. 1. Binomial probability distributions of sample size n ¼ 10 and probability parameter w ¼ 0:2 (top) and w ¼ 0:7 (bottom). I.J. Myung / Journal of Mathematical Psychology 47 (2003) 90–100 91