正在加载图片...

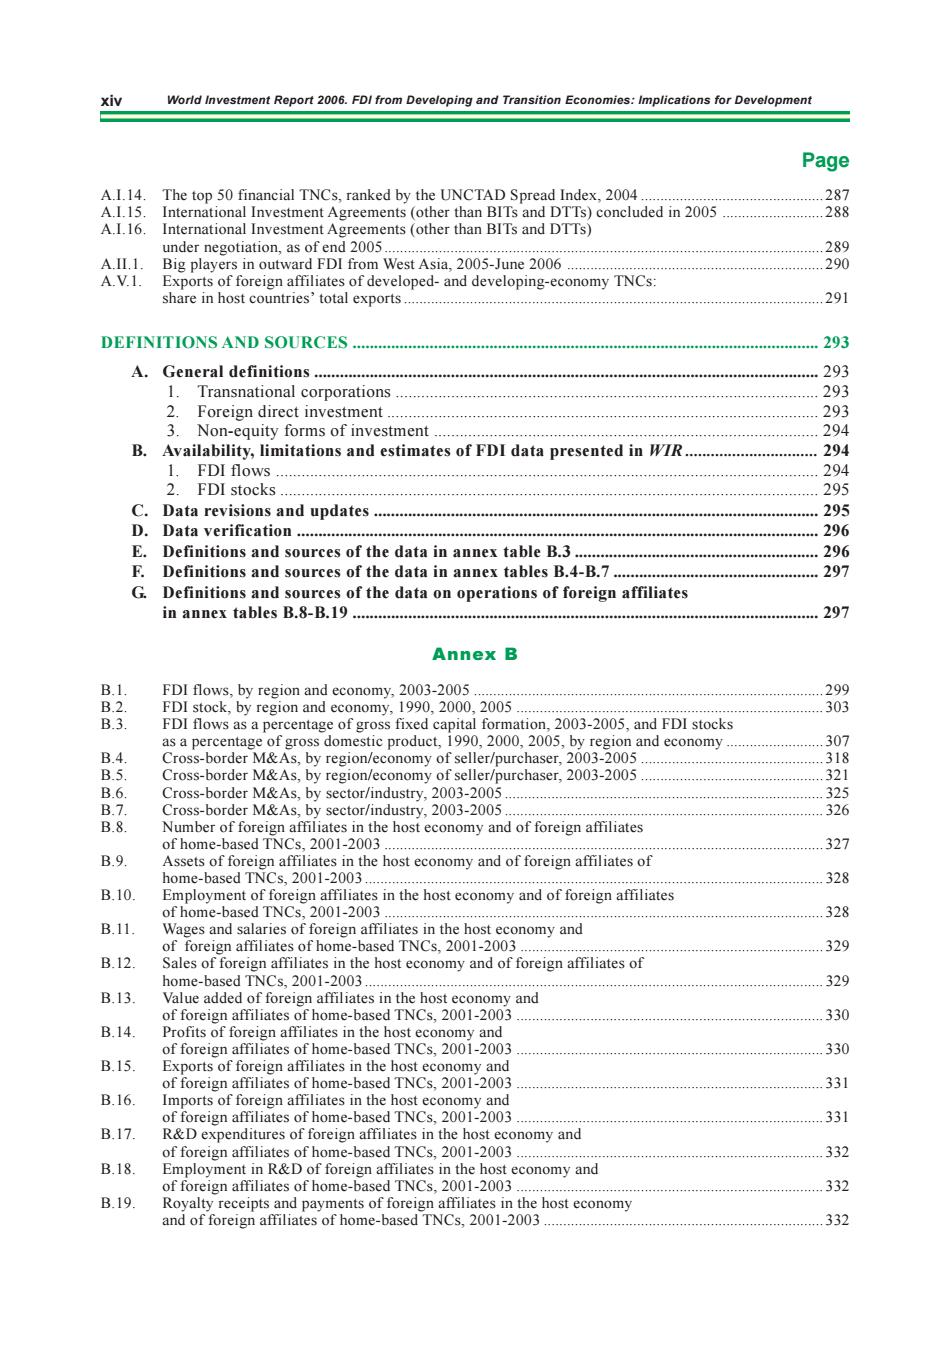
Page The top TNCs.ranked by the UNCTAD Spread ded in 2005 38 onomy TNCs 291 DEFINITIONS AND SOURCES 293 4 General definitior 292 Transnational corporation 293 23 Foreign direct investment timate of FDI dat presented i 294 FDI fows FDI stocks Definitions and sources of the data in annex table B.3. 29 Definitions and sources of the data in annex tables B.4-B.7. 297 Pefiiigaggeiyorhehtaoaopcrmioasorforcignamiaite 297 Annex B and e 2003-2005 38 2003-2005.and FDI stocks r/purchaser. 2003-200 327 B.10 in the host 328 328 B.11 onomy and 329 B.12 329 B.13 330 B.14 B.15 orts of 330 331 B.16 in the ed the h 331 B.17 f foreig nomy and 332 B.18 economy and 332 B19 and offorei 332 xiv World Investment Report 2006. FDI from Developing and Transition Economies: Implications for Development A.I.14. The top 50 financial TNCs, ranked by the UNCTAD Spread Index, 2004 ............................................... 287 A.I.15. International Investment Agreements (other than BITs and DTTs) concluded in 2005 .......................... 288 A.I.16. International Investment Agreements (other than BITs and DTTs) under negotiation, as of end 2005................................................................................................................. 289 A.II.1. Big players in outward FDI from West Asia, 2005-June 2006 .................................................................. 290 A.V.1. Exports of foreign affiliates of developed- and developing-economy TNCs: share in host countries’ total exports............................................................................................................ 291 DEFINITIONS AND SOURCES ............................................................................................................. 293 A. General definitions ...................................................................................................................... 293 1. Transnational corporations ................................................................................................... 293 2. Foreign direct investment ..................................................................................................... 293 3. Non-equity forms of investment .......................................................................................... 294 B. Availability, limitations and estimates of FDI data presented in WIR ............................... 294 1. FDI flows ............................................................................................................................... 294 2. FDI stocks .............................................................................................................................. 295 C. Data revisions and updates ........................................................................................................ 295 D. Data verification .......................................................................................................................... 296 E. Definitions and sources of the data in annex table B.3 ......................................................... 296 F. Definitions and sources of the data in annex tables B.4-B.7 ................................................ 297 G. Definitions and sources of the data on operations of foreign affiliates in annex tables B.8-B.19 ............................................................................................................. 297 B.1. FDI flows, by region and economy, 2003-2005 .......................................................................................... 299 B.2. FDI stock, by region and economy, 1990, 2000, 2005 ............................................................................... 303 B.3. FDI flows as a percentage of gross fixed capital formation, 2003-2005, and FDI stocks as a percentage of gross domestic product, 1990, 2000, 2005, by region and economy ......................... 307 B.4. Cross-border M&As, by region/economy of seller/purchaser, 2003-2005 ............................................... 318 B.5. Cross-border M&As, by region/economy of seller/purchaser, 2003-2005 ............................................... 321 B.6. Cross-border M&As, by sector/industry, 2003-2005 .................................................................................. 325 B.7. Cross-border M&As, by sector/industry, 2003-2005 .................................................................................. 326 B.8. Number of foreign affiliates in the host economy and of foreign affiliates of home-based TNCs, 2001-2003 ................................................................................................................. 327 B.9. Assets of foreign affiliates in the host economy and of foreign affiliates of home-based TNCs, 2001-2003 ...................................................................................................................... 328 B.10. Employment of foreign affiliates in the host economy and of foreign affiliates of home-based TNCs, 2001-2003 ................................................................................................................. 328 B.11. Wages and salaries of foreign affiliates in the host economy and of foreign affiliates of home-based TNCs, 2001-2003 .............................................................................. 329 B.12. Sales of foreign affiliates in the host economy and of foreign affiliates of home-based TNCs, 2001-2003 ...................................................................................................................... 329 B.13. Value added of foreign affiliates in the host economy and of foreign affiliates of home-based TNCs, 2001-2003 ............................................................................... 330 B.14. Profits of foreign affiliates in the host economy and of foreign affiliates of home-based TNCs, 2001-2003 ............................................................................... 330 B.15. Exports of foreign affiliates in the host economy and of foreign affiliates of home-based TNCs, 2001-2003 ............................................................................... 331 B.16. Imports of foreign affiliates in the host economy and of foreign affiliates of home-based TNCs, 2001-2003 ............................................................................... 331 B.17. R&D expenditures of foreign affiliates in the host economy and of foreign affiliates of home-based TNCs, 2001-2003 ............................................................................... 332 B.18. Employment in R&D of foreign affiliates in the host economy and of foreign affiliates of home-based TNCs, 2001-2003 ............................................................................... 332 B.19. Royalty receipts and payments of foreign affiliates in the host economy and of foreign affiliates of home-based TNCs, 2001-2003 ........................................................................ 332 Page�