正在加载图片...
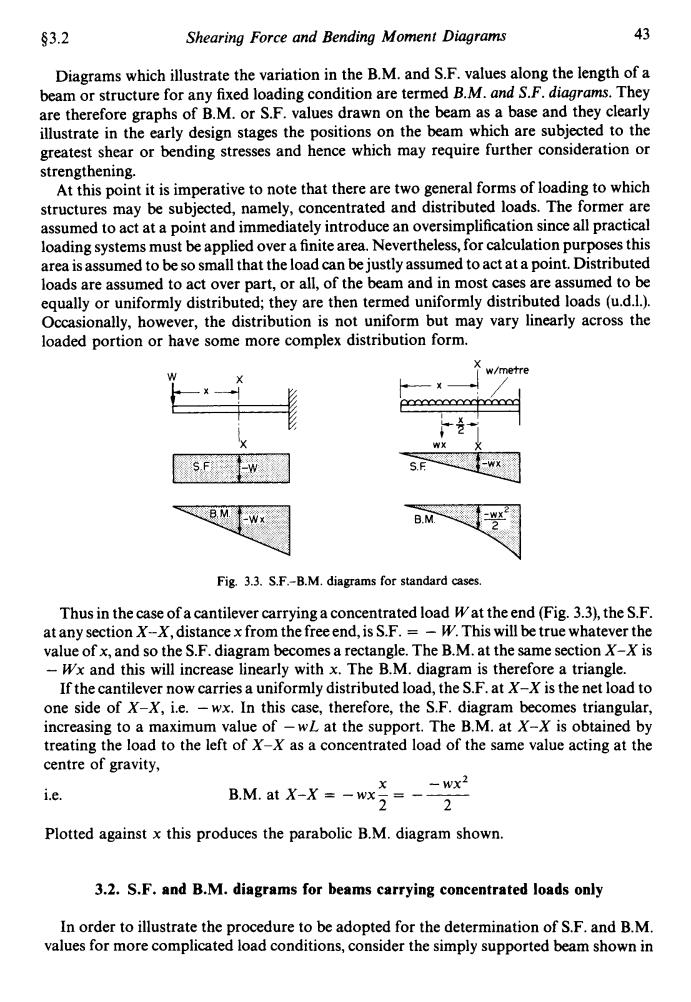
§3.2 Shearing Force and Bending Moment Diagrams 43 Diagrams which illustrate the variation in the B.M.and S.F.values along the length of a beam or structure for any fixed loading condition are termed B.M.and S.F.diagrams.They are therefore graphs of B.M.or S.F.values drawn on the beam as a base and they clearly illustrate in the early design stages the positions on the beam which are subjected to the greatest shear or bending stresses and hence which may require further consideration or strengthening. At this point it is imperative to note that there are two general forms of loading to which structures may be subjected,namely,concentrated and distributed loads.The former are assumed to act at a point and immediately introduce an oversimplification since all practical loading systems must be applied over a finite area.Nevertheless,for calculation purposes this area is assumed to be so small that the load can be justly assumed to act at a point.Distributed loads are assumed to act over part,or all,of the beam and in most cases are assumed to be equally or uniformly distributed;they are then termed uniformly distributed loads(u.d.1.). Occasionally,however,the distribution is not uniform but may vary linearly across the loaded portion or have some more complex distribution form. w/metre aaaaaaach0 S.F B.M Fig.3.3.S.F.-B.M.diagrams for standard cases. Thus in the case of a cantilever carrying a concentrated load Wat the end(Fig.3.3),the S.F. at any section X-X,distance x from the freeend,is S.F.=-W.This will be true whatever the value of x,and so the S.F.diagram becomes a rectangle.The B.M.at the same section X-X is -Wx and this will increase linearly with x.The B.M.diagram is therefore a triangle. If the cantilever now carries a uniformly distributed load,the S.F.at X-X is the net load to one side of X-X,i.e.-wx.In this case,therefore,the S.F.diagram becomes triangular, increasing to a maximum value of-wL at the support.The B.M.at X-X is obtained by treating the load to the left of X-X as a concentrated load of the same value acting at the centre of gravity, i.e. .-wx2 B.M.at X-X -wx2=-- 2 Plotted against x this produces the parabolic B.M.diagram shown. 3.2.S.F.and B.M.diagrams for beams carrying concentrated loads only In order to illustrate the procedure to be adopted for the determination of S.F.and B.M. values for more complicated load conditions,consider the simply supported beam shown in$3.2 Shearing Force and Bending Moment Diagrams 43 Diagrams which illustrate the variation in the B.M. and S.F. values along the length of a beam or structure for any fixed loading condition are termed B.M. and S.F. diagrams. They are therefore graphs of B.M. or S.F. values drawn on the beam as a base and they clearly illustrate in the early design stages the positions on the beam which are subjected to the greatest shear or bending stresses and hence which may require further consideration or strengthening. At this point it is imperative to note that there are two general forms of loading to which structures may be subjected, namely, concentrated and distributed loads. The former are assumed to act at a point and immediately introduce an oversimplification since all practical loading systems must be applied over a finite area. Nevertheless, for calculation purposes this area is assumed to be so small that the load can be justly assumed to act at a point. Distributed loads are assumed to act over part, or all, of the beam and in most cases are assumed to be equally or uniformly distributed; they are then termed uniformly distributed loads (u.d.1.). Occasionally, however, the distribution is not uniform but may vary linearly across the loaded portion or have some more complex distribution form. 'X wx k Fig. 3.3. S.F.-B.M. diagrams for standard cases. Thus in the case of a cantilever carrying a concentrated load Wat the end (Fig. 3.3), the S.F. at any section X-X, distance x from the free end, is S.F. = - W. This will be true whatever the value of x, and so the S.F. diagram becomes a rectangle. The B.M. at the same section X-X is - Wx and this will increase linearly with x. The B.M. diagram is therefore a triangle. If the cantilever now carries a uniformly distributed load, the S.F. at X-X is the net load to one side of X-X, i.e. -wx. In this case, therefore, the S.F. diagram becomes triangular, increasing to a maximum value of - WL at the support. The B.M. at X-X is obtained by treating the load to the left of X-X as a concentrated load of the same value acting at the centre of gravity, i.e. X - wx2 B.M. at X-X = - wx - = - __ 2 2 Plotted against x this produces the parabolic B.M. diagram shown. 3.2. S.F. and B.M. diagrams for beams carrying concentrated loads only In order to illustrate the procedure to be adopted for the determination of S.F. and B.M. values for more complicated load conditions, consider the simply supported beam shown in