正在加载图片...

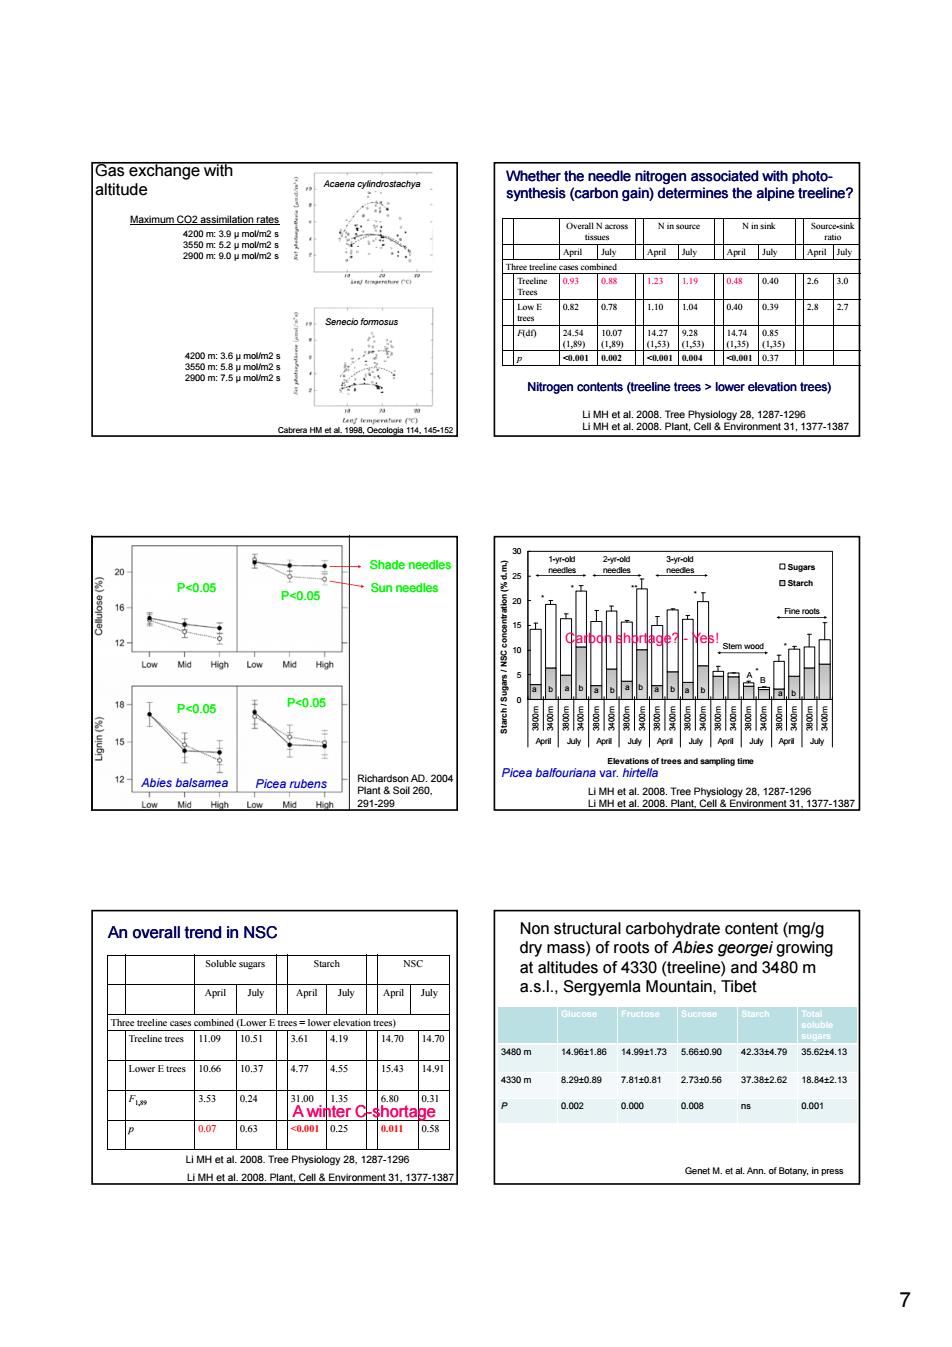
echange wit而 edle nit a 02 LowE O.K2 07E1.10 1.080.400.3928 Nitrogen contents (treeline trees lower elevation trees) 出l80aeta2a2a29.1387 P0.05 P<005 Low Md Low Pe0.0 0.og 出m28m82a12a9.13a An overall trend in NSC 14014.7 480 1461.616.a7刀53能0.9023447935524 10. 54 .53 A winter C a07 163 10.2 LI MH et aL 200 cel&E白 77 Gas exchange with altitude Acaena cylindrostachya Maximum CO2 assimilation rates 4200 m: 3.9 µ mol/m2 s 3550 m: 5.2 µ mol/m2 s 2900 m: 9.0 µ mol/m2 s Cabrera HM et al. 1998, Oecologia 114, 145-152 Senecio formosus 4200 m: 3.6 µ mol/m2 s 3550 m: 5.8 µ mol/m2 s 2900 m: 7.5 µ mol/m2 s Overall N across tissues N in source N in sink Source-sink ratio April July April July April July April July Three treeline cases combined Treeline Trees 0.93 0.88 1.23 1.19 0.48 0.40 2.6 3.0 Whether the needle nitrogen associated with photo Whether the needle nitrogen associated with photosynthesis (carbon gain) determines the alpine treeline? Low E trees 0.82 0.78 1.10 1.04 0.40 0.39 2.8 2.7 F(df) 24.54 (1,89) 10.07 (1,89) 14.27 (1,53) 9.28 (1,53) 14.74 (1,35) 0.85 (1,35) p <0.001 0.002 <0.001 0.004 <0.001 0.37 Nitrogen contents (treeline trees > lower elevation trees) Li MH et al. 2008. Tree Physiology 28, 1287-1296 Li MH et al. 2008. Plant, Cell & Environment 31, 1377-1387 P<0.05 P<0.05 Shade needles Sun needles Richardson AD. 2004 Plant & Soil 260, 291-299 P<0.05 P<0.05 Abies balsamea Picea rubens 5 10 15 20 25 30 / NSC concentration (% d.m.) Sugars Starch 1-yr-old needles Stem wood Fine roots * A * ** * * * 2-yr-old needles 3-yr-old needles Carbon shortage? - Yes! 0 5 3800m 3400m 3800m 3400m 3800m 3400m 3800m 3400m 3800m 3400m 3800m 3400m 3800m 3400m 3800m 3400m 3800m 3400m 3800m 3400m April July April July April July April July April July Elevations of trees and sampling time Starch / Sugars a b a a a a a a b b b b b b A B Li MH et al. 2008. Tree Physiology 28, 1287-1296 Li MH et al. 2008. Plant, Cell & Environment 31, 1377-1387 Picea balfouriana var. hirtella Soluble sugars Starch NSC April July April July April July Three treeline cases combined (Lower E trees = lower elevation trees) Treeline trees 11.09 10.51 3.61 4.19 14.70 14.70 An overall trend in NSC Lower E trees 10.66 10.37 4.77 4.55 15.43 14.91 F1,89 3.53 0.24 31.00 1.35 6.80 0.31 p 0.07 0.63 <0.001 0.25 0.011 0.58 Li MH et al. 2008. Tree Physiology 28, 1287-1296 Li MH et al. 2008. Plant, Cell & Environment 31, 1377-1387 A winter C A winter C-shortage shortage Glucose Fructose Sucrose Starch Total soluble sugars Non structural carbohydrate content (mg/g dry mass) of roots of Abies georgei growing at altitudes of 4330 (treeline) and 3480 m a.s.l., Sergyemla Mountain, Tibet 3480 m 14.96±1.86 14.99±1.73 5.66±0.90 42.33±4.79 35.62±4.13 4330 m 8.29±0.89 7.81±0.81 2.73±0.56 37.38±2.62 18.84±2.13 P 0.002 0.000 0.008 ns 0.001 Genet M. et al. Ann. of Botany, in press