正在加载图片...
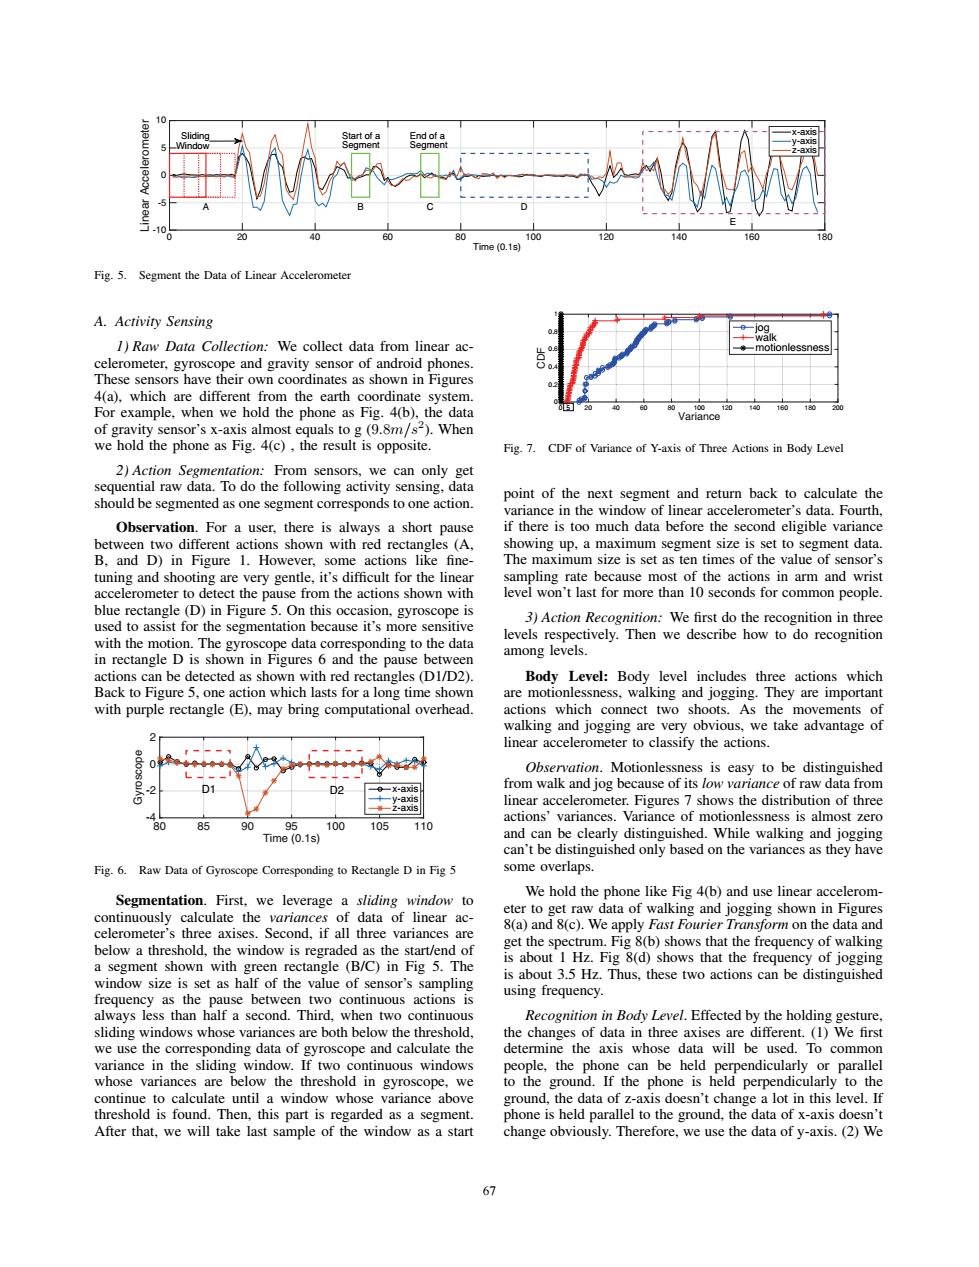
Time (0.1s) Fig.5.Segment the Data of Linear Accelerometer A.Activity Sensing 10g 1)Raw Data Collection:We collect data from linear ac- celerometer,gyroscope and gravity sensor of android phones. These sensors have their own coordinates as shown in Figures 4(a).which are different from the earth coordinate system. For example,when we hold the phone as Fig.4(b).the data 80 100 120 Variance of gravity sensor's x-axis almost equals to g(9.8m/s2).When we hold the phone as Fig.4(c),the result is opposite. Fig.7.CDF of Variance of Y-axis of Three Actions in Body Level 2)Action Segmentation:From sensors,we can only get sequential raw data.To do the following activity sensing,data point of the next segment and return back to calculate the should be segmented as one segment corresponds to one action. variance in the window of linear accelerometer's data.Fourth Observation.For a user,there is always a short pause if there is too much data before the second eligible variance between two different actions shown with red rectangles (A showing up,a maximum segment size is set to segment data. B.and D)in Figure 1.However,some actions like fine- The maximum size is set as ten times of the value of sensor's tuning and shooting are very gentle,it's difficult for the linear sampling rate because most of the actions in arm and wrist accelerometer to detect the pause from the actions shown with level won't last for more than 10 seconds for common people. blue rectangle (D)in Figure 5.On this occasion,gyroscope is used to assist for the segmentation because it's more sensitive 3)Action Recognition:We first do the recognition in three with the motion.The gyroscope data corresponding to the data levels respectively.Then we describe how to do recognition in rectangle D is shown in Figures 6 and the pause between among levels. actions can be detected as shown with red rectangles (D1/D2) Body Level:Body level includes three actions which Back to Figure 5,one action which lasts for a long time shown are motionlessness,walking and jogging.They are important with purple rectangle (E).may bring computational overhead actions which connect two shoots.As the movements of walking and jogging are very obvious,we take advantage of linear accelerometer to classify the actions. 2 0 Observation.Motionlessness is easy to be distinguished 01 D2 x-axis from walk and jog because of its low variance of raw data from linear accelerometer.Figures 7 shows the distribution of three z-as actions'variances.Variance of motionlessness is almost zero 0 85 90 100 105 110 Time (0.1s) and can be clearly distinguished.While walking and jogging can't be distinguished only based on the variances as they have Fig.6.Raw Data of Gyroscope Corresponding to Rectangle D in Fig 5 some overlaps. We hold the phone like Fig 4(b)and use linear accelerom- Segmentation.First,we leverage a sliding window to eter to get raw data of walking and jogging shown in Figures continuously calculate the variances of data of linear ac- celerometer's three axises.Second,if all three variances are 8(a)and 8(c).We apply Fast Fourier Transform on the data and below a threshold,the window is regraded as the start/end of get the spectrum.Fig 8(b)shows that the frequency of walking a segment shown with green rectangle (B/C)in Fig 5.The is about I Hz.Fig 8(d)shows that the frequency of jogging window size is set as half of the value of sensor's sampling is about 3.5 Hz.Thus,these two actions can be distinguished using frequency frequency as the pause between two continuous actions is always less than half a second.Third,when two continuous Recognition in Body Level.Effected by the holding gesture, sliding windows whose variances are both below the threshold the changes of data in three axises are different.(1)We first we use the corresponding data of gyroscope and calculate the determine the axis whose data will be used.To common variance in the sliding window.If two continuous windows people,the phone can be held perpendicularly or parallel whose variances are below the threshold in gyroscope,we to the ground.If the phone is held perpendicularly to the continue to calculate until a window whose variance above ground,the data of z-axis doesn't change a lot in this level.If threshold is found.Then,this part is regarded as a segment. phone is held parallel to the ground,the data of x-axis doesn't After that,we will take last sample of the window as a start change obviously.Therefore,we use the data of y-axis.(2)We 67Time (0.1s) 0 20 40 60 80 100 120 140 160 180 Linear Accelerometer -10 -5 0 5 10 x-axis y-axis z-axis Start of a Segment End of a Segment A B C D E Sliding Window Fig. 5. Segment the Data of Linear Accelerometer A. Activity Sensing 1) Raw Data Collection: We collect data from linear accelerometer, gyroscope and gravity sensor of android phones. These sensors have their own coordinates as shown in Figures 4(a), which are different from the earth coordinate system. For example, when we hold the phone as Fig. 4(b), the data of gravity sensor’s x-axis almost equals to g (9.8m/s2). When we hold the phone as Fig. 4(c) , the result is opposite. 2) Action Segmentation: From sensors, we can only get sequential raw data. To do the following activity sensing, data should be segmented as one segment corresponds to one action. Observation. For a user, there is always a short pause between two different actions shown with red rectangles (A, B, and D) in Figure 1. However, some actions like finetuning and shooting are very gentle, it’s difficult for the linear accelerometer to detect the pause from the actions shown with blue rectangle (D) in Figure 5. On this occasion, gyroscope is used to assist for the segmentation because it’s more sensitive with the motion. The gyroscope data corresponding to the data in rectangle D is shown in Figures 6 and the pause between actions can be detected as shown with red rectangles (D1/D2). Back to Figure 5, one action which lasts for a long time shown with purple rectangle (E), may bring computational overhead. Time (0.1s) 80 85 90 95 100 105 110 Gyroscope -4 -2 0 2 x-axis y-axis z-axis D1 D2 Fig. 6. Raw Data of Gyroscope Corresponding to Rectangle D in Fig 5 Segmentation. First, we leverage a sliding window to continuously calculate the variances of data of linear accelerometer’s three axises. Second, if all three variances are below a threshold, the window is regraded as the start/end of a segment shown with green rectangle (B/C) in Fig 5. The window size is set as half of the value of sensor’s sampling frequency as the pause between two continuous actions is always less than half a second. Third, when two continuous sliding windows whose variances are both below the threshold, we use the corresponding data of gyroscope and calculate the variance in the sliding window. If two continuous windows whose variances are below the threshold in gyroscope, we continue to calculate until a window whose variance above threshold is found. Then, this part is regarded as a segment. After that, we will take last sample of the window as a start Variance 0 20 40 60 80 100 120 140 160 180 200 CDF 0 0.2 0.4 0.6 0.8 1 jog walk motionlessness 5 Fig. 7. CDF of Variance of Y-axis of Three Actions in Body Level point of the next segment and return back to calculate the variance in the window of linear accelerometer’s data. Fourth, if there is too much data before the second eligible variance showing up, a maximum segment size is set to segment data. The maximum size is set as ten times of the value of sensor’s sampling rate because most of the actions in arm and wrist level won’t last for more than 10 seconds for common people. 3) Action Recognition: We first do the recognition in three levels respectively. Then we describe how to do recognition among levels. Body Level: Body level includes three actions which are motionlessness, walking and jogging. They are important actions which connect two shoots. As the movements of walking and jogging are very obvious, we take advantage of linear accelerometer to classify the actions. Observation. Motionlessness is easy to be distinguished from walk and jog because of its low variance of raw data from linear accelerometer. Figures 7 shows the distribution of three actions’ variances. Variance of motionlessness is almost zero and can be clearly distinguished. While walking and jogging can’t be distinguished only based on the variances as they have some overlaps. We hold the phone like Fig 4(b) and use linear accelerometer to get raw data of walking and jogging shown in Figures 8(a) and 8(c). We apply Fast Fourier Transform on the data and get the spectrum. Fig 8(b) shows that the frequency of walking is about 1 Hz. Fig 8(d) shows that the frequency of jogging is about 3.5 Hz. Thus, these two actions can be distinguished using frequency. Recognition in Body Level. Effected by the holding gesture, the changes of data in three axises are different. (1) We first determine the axis whose data will be used. To common people, the phone can be held perpendicularly or parallel to the ground. If the phone is held perpendicularly to the ground, the data of z-axis doesn’t change a lot in this level. If phone is held parallel to the ground, the data of x-axis doesn’t change obviously. Therefore, we use the data of y-axis. (2) We 67