正在加载图片...

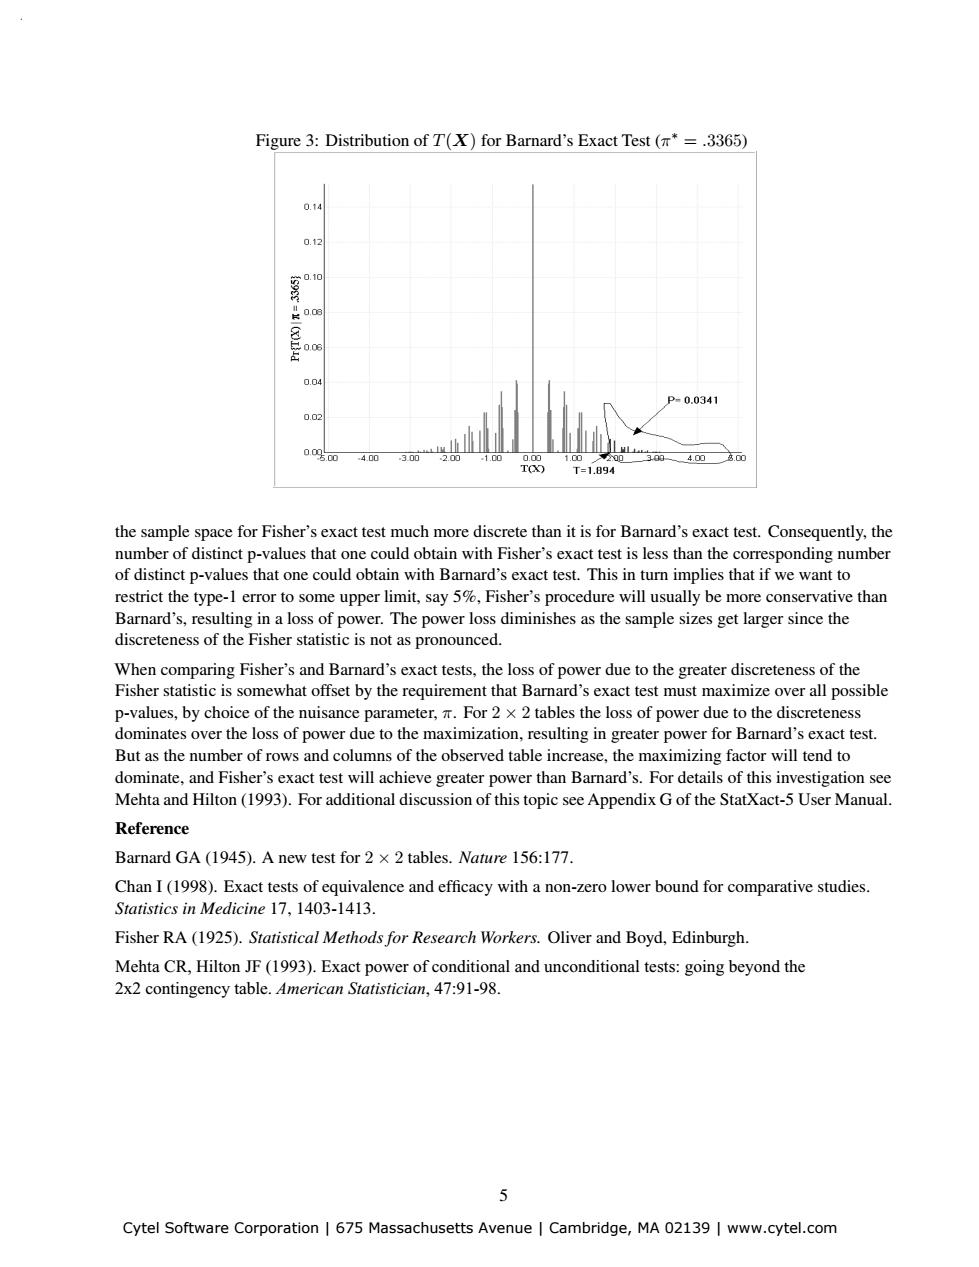
Figure 3:Distribution of T(X)for Barnard's Exact Test(*=.3365) 0.14 0.12 0.0 0.04 P=0.0341 0.02 4.00 3.0元 30g 4.00 T T=1.894 the sample space for Fisher's exact test much more discrete than it is for Barnard's exact test.Consequently,the number of distinct p-values that one could obtain with Fisher's exact test is less than the corresponding number of distinct p-values that one could obtain with Barnard's exact test.This in turn implies that if we want to restrict the type-1 error to some upper limit,say 5%,Fisher's procedure will usually be more conservative than Barnard's,resulting in a loss of power.The power loss diminishes as the sample sizes get larger since the discreteness of the Fisher statistic is not as pronounced. When comparing Fisher's and Barnard's exact tests,the loss of power due to the greater discreteness of the Fisher statistic is somewhat offset by the requirement that Barnard's exact test must maximize over all possible p-values,by choice of the nuisance parameter,For 2 x 2 tables the loss of power due to the discreteness dominates over the loss of power due to the maximization,resulting in greater power for Barnard's exact test. But as the number of rows and columns of the observed table increase,the maximizing factor will tend to dominate,and Fisher's exact test will achieve greater power than Barnard's.For details of this investigation see Mehta and Hilton(1993).For additional discussion of this topic see Appendix G of the StatXact-5 User Manual. Reference Barnard GA(1945).A new test for 2 x 2 tables.Nature 156:177. Chan I(1998).Exact tests of equivalence and efficacy with a non-zero lower bound for comparative studies. Statistics in Medicine 17,1403-1413. Fisher RA(1925).Statistical Methods for Research Workers.Oliver and Boyd,Edinburgh. Mehta CR,Hilton JF(1993).Exact power of conditional and unconditional tests:going beyond the 2x2 contingency table.American Statistician,47:91-98. 5 Cytel Software Corporation 675 Massachusetts Avenue Cambridge,MA 02139 www.cytel.comFigure 3: Distribution of T(X) for Barnard’s Exact Test (π∗ = .3365) the sample space for Fisher’s exact test much more discrete than it is for Barnard’s exact test. Consequently, the number of distinct p-values that one could obtain with Fisher’s exact test is less than the corresponding number of distinct p-values that one could obtain with Barnard’s exact test. This in turn implies that if we want to restrict the type-1 error to some upper limit, say 5%, Fisher’s procedure will usually be more conservative than Barnard’s, resulting in a loss of power. The power loss diminishes as the sample sizes get larger since the discreteness of the Fisher statistic is not as pronounced. When comparing Fisher’s and Barnard’s exact tests, the loss of power due to the greater discreteness of the Fisher statistic is somewhat offset by the requirement that Barnard’s exact test must maximize over all possible p-values, by choice of the nuisance parameter, π. For 2 × 2 tables the loss of power due to the discreteness dominates over the loss of power due to the maximization, resulting in greater power for Barnard’s exact test. But as the number of rows and columns of the observed table increase, the maximizing factor will tend to dominate, and Fisher’s exact test will achieve greater power than Barnard’s. For details of this investigation see Mehta and Hilton (1993). For additional discussion of this topic see Appendix G of the StatXact-5 User Manual. Reference Barnard GA (1945). A new test for 2 × 2 tables. Nature 156:177. Chan I (1998). Exact tests of equivalence and efficacy with a non-zero lower bound for comparative studies. Statistics in Medicine 17, 1403-1413. Fisher RA (1925). Statistical Methods for Research Workers. Oliver and Boyd, Edinburgh. Mehta CR, Hilton JF (1993). Exact power of conditional and unconditional tests: going beyond the 2x2 contingency table. American Statistician, 47:91-98. 5 Cytel Software Corporation | 675 Massachusetts Avenue | Cambridge, MA 02139 | www.cytel.com