正在加载图片...
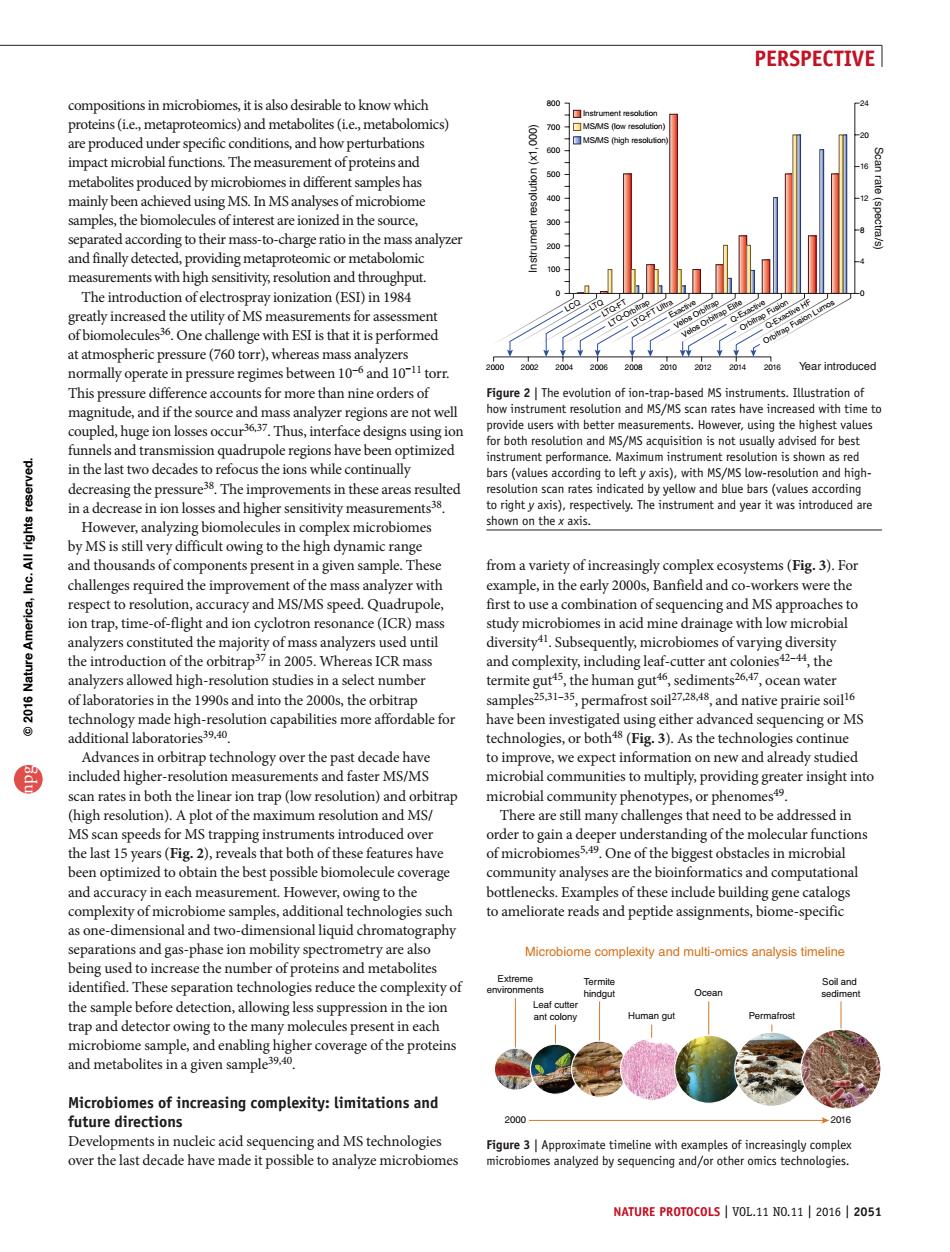
PERSPECTIVE compositions in microbiomes,it is also desirable to know which are pro ow per metabolites prpduced by microbiom s in differ des ha mainly been achieved using MS In MSanalyses of microbiome ttheir mass-to- a& The introduction of electrospray ionization(ESD)in1984 asurements for assessment lenge with ESI is that it is performed 10 torr This p sure difference accounts for more than nine orders of ge ion lo Hesigns using ion ith bette vesing the perform ution is s re in the last while decre asing the pressure The improvements in these areas resulted on thex axis. ctively.The instrument and year it was intro eo ar cult nd tho ms (Fig.3).Fo challenges required the improvement of the ample in the early 2000s Banfield and co-workers were the respect to resolution,accuracy and MS/MS speed.Quadrupole, first to use a combination of sequencing and MS approaches to on trap,tim -of-fligl ance (ICR)m iomes in acid min drainage with lo hezsioedhig,esolnicnsndesnaselctnmber thehuan女edumet ce of laboratories in the 1990s and into the 2000s,the orbitrap -35.permafrost 48 and native prairie soill high-o capabilities more affordable for equencing or MS logies,or 83 can rates in both the linear ion trap (low resolution)and orbitrap microbial community phenotypes,or phenomes (high resolution).Aplot of the maximum resolution and MS There are still many ch enges that ne eed tobe addressed in rapping been ontimized to obtain the best no ssible biomolecule coverage mmunity analyses are the bioinformatics and computational and accuracy in each measurement.However,owing to the bottlenecks.Examples of these include building gene catalogs complexity of microbiome samples,additi nal technologies such to ameliorate reads and peptide assignments,biome-specific as one a tw onal liquid chromatography sed to increase the number of p lexity and analysis timeline identified.These separation technologies reduce the complexity of the sample before detection,allowing less suppression in the ion ng to Microbiomes of increasing complexity:limitationsand uture directi acid and MS technologi over the last decade have made it possible to analyze microbome gueAproieineineiheapeioficreioayope NATURE PROTOCOLS I VOL.11 NO.11 1 2016 I 2051NATURE PROTOCOLS | VOL.11 NO.11 | 2016 | 2051 PERSPECTIVE from a variety of increasingly complex ecosystems (Fig. 3). For example, in the early 2000s, Banfield and co-workers were the first to use a combination of sequencing and MS approaches to study microbiomes in acid mine drainage with low microbial diversity41. Subsequently, microbiomes of varying diversity and complexity, including leaf-cutter ant colonies42–44, the termite gut45, the human gut46, sediments26,47, ocean water samples25,31–35, permafrost soil27,28,48, and native prairie soil16 have been investigated using either advanced sequencing or MS technologies, or both48 (Fig. 3). As the technologies continue to improve, we expect information on new and already studied microbial communities to multiply, providing greater insight into microbial community phenotypes, or phenomes49. There are still many challenges that need to be addressed in order to gain a deeper understanding of the molecular functions of microbiomes5,49. One of the biggest obstacles in microbial community analyses are the bioinformatics and computational bottlenecks. Examples of these include building gene catalogs to ameliorate reads and peptide assignments, biome-specific compositions in microbiomes, it is also desirable to know which proteins (i.e., metaproteomics) and metabolites (i.e., metabolomics) are produced under specific conditions, and how perturbations impact microbial functions. The measurement of proteins and metabolites produced by microbiomes in different samples has mainly been achieved using MS. In MS analyses of microbiome samples, the biomolecules of interest are ionized in the source, separated according to their mass-to-charge ratio in the mass analyzer and finally detected, providing metaproteomic or metabolomic measurements with high sensitivity, resolution and throughput. The introduction of electrospray ionization (ESI) in 1984 greatly increased the utility of MS measurements for assessment of biomolecules36. One challenge with ESI is that it is performed at atmospheric pressure (760 torr), whereas mass analyzers normally operate in pressure regimes between 10-6 and 10-11 torr. This pressure difference accounts for more than nine orders of magnitude, and if the source and mass analyzer regions are not well coupled, huge ion losses occur36,37. Thus, interface designs using ion funnels and transmission quadrupole regions have been optimized in the last two decades to refocus the ions while continually decreasing the pressure38. The improvements in these areas resulted in a decrease in ion losses and higher sensitivity measurements38. However, analyzing biomolecules in complex microbiomes by MS is still very difficult owing to the high dynamic range and thousands of components present in a given sample. These challenges required the improvement of the mass analyzer with respect to resolution, accuracy and MS/MS speed. Quadrupole, ion trap, time-of-flight and ion cyclotron resonance (ICR) mass analyzers constituted the majority of mass analyzers used until the introduction of the orbitrap37 in 2005. Whereas ICR mass analyzers allowed high-resolution studies in a select number of laboratories in the 1990s and into the 2000s, the orbitrap technology made high-resolution capabilities more affordable for additional laboratories39,40. Advances in orbitrap technology over the past decade have included higher-resolution measurements and faster MS/MS scan rates in both the linear ion trap (low resolution) and orbitrap (high resolution). A plot of the maximum resolution and MS/ MS scan speeds for MS trapping instruments introduced over the last 15 years (Fig. 2), reveals that both of these features have been optimized to obtain the best possible biomolecule coverage and accuracy in each measurement. However, owing to the complexity of microbiome samples, additional technologies such as one-dimensional and two-dimensional liquid chromatography separations and gas-phase ion mobility spectrometry are also being used to increase the number of proteins and metabolites identified. These separation technologies reduce the complexity of the sample before detection, allowing less suppression in the ion trap and detector owing to the many molecules present in each microbiome sample, and enabling higher coverage of the proteins and metabolites in a given sample39,40. Microbiomes of increasing complexity: limitations and future directions Developments in nucleic acid sequencing and MS technologies over the last decade have made it possible to analyze microbiomes LCQ LTQ LTQ-FT LTQ-Orbitrap LTQ-FT Ultra Exactive Velos Orbitrap Velos Orbitrap Elite Q-Exactive Orbitrap Fusion Q-Exactive HF Orbitrap Fusion Lumos 0 4 8 12 16 20 24 2000 2002 2004 2006 2008 2010 2012 2014 2016 0 100 200 300 400 500 600 700 800 MS/MS (low resolution) Instrument resolution Instrument resolution (x1,000) Scan rate (spectra/s) Year introduced MS/MS (high resolution) Soil and sediment Permafrost Ocean Human gut Leaf cutter ant colony Termite hindgut Extreme environments Microbiome complexity and multi-omics analysis timeline 2000 2016 Figure 3 | Approximate timeline with examples of increasingly complex microbiomes analyzed by sequencing and/or other omics technologies. Figure 2 | The evolution of ion-trap-based MS instruments. Illustration of how instrument resolution and MS/MS scan rates have increased with time to provide users with better measurements. However, using the highest values for both resolution and MS/MS acquisition is not usually advised for best instrument performance. Maximum instrument resolution is shown as red bars (values according to left y axis), with MS/MS low-resolution and highresolution scan rates indicated by yellow and blue bars (values according to right y axis), respectively. The instrument and year it was introduced are shown on the x axis. npg © 2016 Nature America, Inc. All rights reserved