正在加载图片...
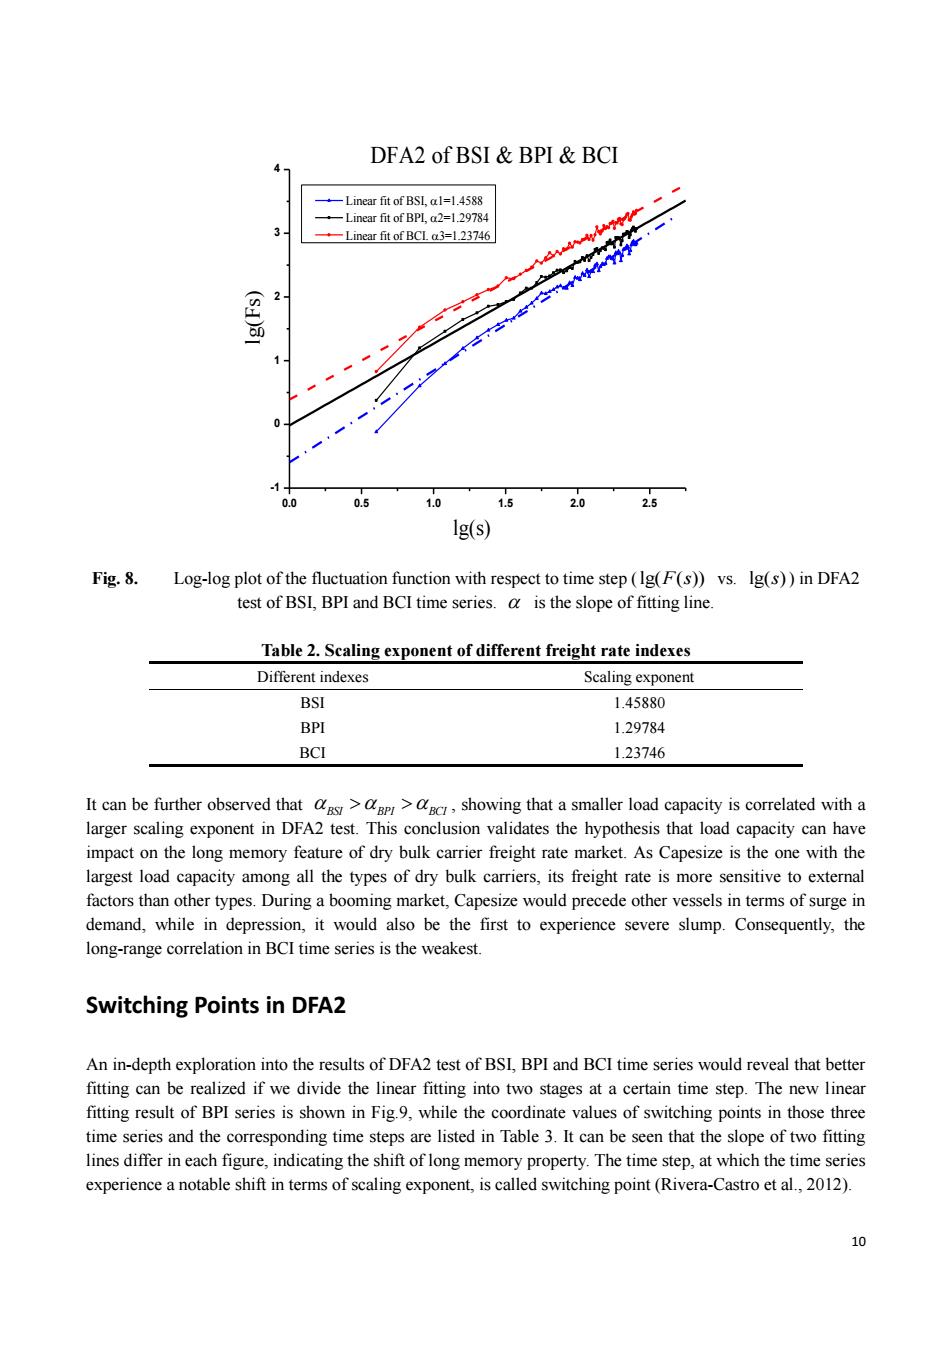
DFA2 of BSI BPI BCI 4 -Linear fit of BSL,al=1.4588 Linear fit of BPL,a2=1.29784 Linear fit of BCL a3=1.23746 (sd) 0 0.0 0.5 1.0 1.5 2.0 2.5 Ig(s) Fig.8. Log-log plot of the fluctuation function with respect to time step(Ig(F(s))vs.Ig(s))in DFA2 test of BSI,BPI and BCI time series.a is the slope of fitting line. Table 2.Scaling exponent of different freight rate indexes Different indexes Scaling exponent BSI 1.45880 BPI 1.29784 BCI 1.23746 It can be further observed that ags>>c,showing that a smaller load capacity is correlated with a larger scaling exponent in DFA2 test.This conclusion validates the hypothesis that load capacity can have impact on the long memory feature of dry bulk carrier freight rate market.As Capesize is the one with the largest load capacity among all the types of dry bulk carriers,its freight rate is more sensitive to external factors than other types.During a booming market,Capesize would precede other vessels in terms of surge in demand,while in depression,it would also be the first to experience severe slump.Consequently,the long-range correlation in BCI time series is the weakest. Switching Points in DFA2 An in-depth exploration into the results of DFA2 test of BSI,BPI and BCI time series would reveal that better fitting can be realized if we divide the linear fitting into two stages at a certain time step.The new linear fitting result of BPI series is shown in Fig.9,while the coordinate values of switching points in those three time series and the corresponding time steps are listed in Table 3.It can be seen that the slope of two fitting lines differ in each figure,indicating the shift of long memory property.The time step,at which the time series experience a notable shift in terms of scaling exponent,is called switching point(Rivera-Castro et al.,2012). 1010 0.0 0.5 1.0 1.5 2.0 2.5 -1 0 1 2 3 4 lg(s) lg(Fs) DFA2 of BSI & BPI & BCI Linear fit of BSI, 1=1.4588 Linear fit of BPI, 2=1.29784 Linear fit of BCI. 3=1.23746 Fig. 8. Log-log plot of the fluctuation function with respect to time step ( lg( ( )) F s vs. lg( )s ) in DFA2 test of BSI, BPI and BCI time series. is the slope of fitting line. Table 2. Scaling exponent of different freight rate indexes Different indexes Scaling exponent BSI 1.45880 BPI 1.29784 BCI 1.23746 It can be further observed that BSI BPI BCI , showing that a smaller load capacity is correlated with a larger scaling exponent in DFA2 test. This conclusion validates the hypothesis that load capacity can have impact on the long memory feature of dry bulk carrier freight rate market. As Capesize is the one with the largest load capacity among all the types of dry bulk carriers, its freight rate is more sensitive to external factors than other types. During a booming market, Capesize would precede other vessels in terms of surge in demand, while in depression, it would also be the first to experience severe slump. Consequently, the long-range correlation in BCI time series is the weakest. Switching Points in DFA2 An in-depth exploration into the results of DFA2 test of BSI, BPI and BCI time series would reveal that better fitting can be realized if we divide the linear fitting into two stages at a certain time step. The new linear fitting result of BPI series is shown in Fig.9, while the coordinate values of switching points in those three time series and the corresponding time steps are listed in Table 3. It can be seen that the slope of two fitting lines differ in each figure, indicating the shift of long memory property. The time step, at which the time series experience a notable shift in terms of scaling exponent, is called switching point (Rivera-Castro et al., 2012)