上游充通大 SHANGHAI JIAO TONG UNIVERSITY HANGHAI JIAO TONG UINIVERS Long Memory Analysis of Bulk Freight Rate under Structural Breaks Yadong Zeng An Article Submitted to Prof.Li Zhang for the Course of Academic Communication in English 01/03/2016
1 SHANGHAI JIAO TONG UNIVERSITY Long Memory Analysis of Bulk Freight Rate under Structural Breaks Yadong Zeng An Article Submitted to Prof. Li Zhang for the Course of Academic Communication in English 01/03/2016
Table Contents Abstract..… …2 Introduction........ .2 Methodology........ ….4 DFA Model. .4 ICSS Model.… 4 Datg..................... 4 Results and Discussion................ 5 Results of Structural Breaks Test........... 5 Results of Long Memory Test........... 7 Comparison between Different DFA methods.. 7 Seasonal influence.............. 7 BPI Analysis with DFA2.... 8 Comparison between Supramax,Panamax and 9 Switching Points in DFA2...... .10 Conclusion........... 40.11 Acknowledgements........ 12 AStCt:Analysis of freight rate volatility characters under structural breaks is of great importance after year 2008.In this paper,the presence of structural break points in bulk freight rate index time series is investigated by employing the Iterated Cumulative Sum of Squares (ICSS)algorithm.Furthermore,long memory features comparison of different vessel sizes,Supramax,Panamax and Capesize bulk carriers is also accomplished,and emperical results show that dry bulk carriers with smaller load capacity are inclined to have stronger long-range correlation.Results of different types of Detrended Fluctuation Analysis (DFA) Method are compared,and influence of seasonality is taken into consideration.For policy makers and investors with different trading horizons,switching point is an important indicator of different long memory characters of freight rate index time series in different time ranges.Hence switching points in DFA results are picked out and conclusions of long memory feature are achieved. Key words:Freight rate;Long memory:Structural break;Detrended fluctuation analysis. Introduction Freight rate market is a vital component of shipping industry,of which the distinctive characteristic is dynamic and volatile(Zhang et al.,2014).Freight rate volatility represents the fluctuation or dispersion of the freight rate in shipping market.It has been validated by large amount of researches that freight rate volatility can be rather large,while its fluctuation trend can be estimated according to its time-varying feature (Jing, 2008;Kavussanos,1996a;Kavussanos,2003)
2 Table Contents Abstract ..........................................................................................................................................................2 Introduction....................................................................................................................................................2 Methodology ..................................................................................................................................................4 DFA Model...............................................................................................................................................4 ICSS Model...............................................................................................................................................4 Data................................................................................................................................................................4 Results and Discussion.....................................................................................................................................5 Results of Structural Breaks Test ...............................................................................................................5 Results of Long Memory Test....................................................................................................................7 Comparison between Different DFA methods.....................................................................................7 Seasonal influence............................................................................................................................7 BPI Analysis with DFA2......................................................................................................................8 Comparison between Supramax, Panamax and Capesize....................................................................9 Switching Points in DFA2 .................................................................................................................10 Conclusion ....................................................................................................................................................11 Acknowledgements.......................................................................................................................................12 References....................................................................................................................................................12 Abstract: Analysis of freight rate volatility characters under structural breaks is of great importance after year 2008. In this paper, the presence of structural break points in bulk freight rate index time series is investigated by employing the Iterated Cumulative Sum of Squares (ICSS) algorithm. Furthermore, long memory features comparison of different vessel sizes, Supramax, Panamax and Capesize bulk carriers is also accomplished, and emperical results show that dry bulk carriers with smaller load capacity are inclined to have stronger long-range correlation. Results of different types of Detrended Fluctuation Analysis (DFA) Method are compared, and influence of seasonality is taken into consideration. For policy makers and investors with different trading horizons, switching point is an important indicator of different long memory characters of freight rate index time series in different time ranges. Hence switching points in DFA results are picked out and conclusions of long memory feature are achieved. Key words: Freight rate; Long memory; Structural break; Detrended fluctuation analysis. Introduction Freight rate market is a vital component of shipping industry, of which the distinctive characteristic is dynamic and volatile (Zhang et al., 2014). Freight rate volatility represents the fluctuation or dispersion of the freight rate in shipping market. It has been validated by large amount of researches that freight rate volatility can be rather large, while its fluctuation trend can be estimated according to its time-varying feature (Jing, 2008; Kavussanos, 1996a; Kavussanos, 2003)
Recent studies suggested that shocks on volatility have long-lasting effects.This phenomenon is known in the empirical finance literature as long-range dependence behavior or long memory behavior(Charfeddine and Ajmi,2013).When the effects of volatility shocks decay slowly,long memory in volatility would occur. Significance is attached to the long memory feature,mainly for the sake of its accordance with the presence of nonlinear dependence between observations.Although long memory features have been discussed in many fields,including hydrology,Internet traffic,commodity market and energy future market(Barkoulas et al., 1998;Chen et al.,2006;Crato and Ray,2000;Elder and Jin,2007;Ohanissian et al.,2008;Panas,2001;Wang and Wu,2012),few researches focus on the long memory feature in freight rate market.As claimed by Yalama and Celik (2013),different financial markets and different sampling periods may present different characteristics of long-range correlation.Therefore,the long memory study focused on freight rate market is indispensable.In this paper,the Detrended Fluctuation Analysis(DFA)method is employed to study the long memory feature of freight rate volatility and the robustness of long-memory inference on daily freight rate index prediction.Compared with other methods which can be used in long memory analysis,such as Rescaled Range Method(R/S)and spectrum analysis method employed in the study of Kai et al.(Kai et al.,2008),an indisputable advantage of DFA is that it can detect the long-range correlations embedded in a non-stationary time series,without being influenced by spurious detection of apparent long-range correlations caused by external trends.The impact of seasonality has also been taken into account in the optimization of DFA,since literatures have shown that freight rate market is seasonal (Kavussanos.2001.2002). Additionally,a crucial issue that arises when analyzing the characteristic of long memory is that the existence of structural breaks can have influence on the long memory of freight rate volatility.In spite of the considerable researches that focus on long memory features of volatility,long memory studies on time series with structural breaks are still limited.The Iterated Cumulative Sum of Squares(ICSS)algorithm,which was developed by(Inclan and Tiao,1994),is proved to be one of the most popular and useful ways in studying the structural transition points of volatility (Aggarwal et al.,1999;Fernandez and Arago,2003;Malik,2003; Malik et al.,2005).Thus,ICSS method is adopted in order to detect structural break points in this paper. Studies on freight rate volatility as well as the long memory component and structural breaks have been thoroughly established by plentiful empirical studies(Baillie et al.,2007;Elder and Serletis,2008;Fernandez, 2010;Wang and Wu,2012).Nevertheless,tests for potential structural breaks and their impacts on the estimated fractional long memory parameter have been conducted in only a few studies(Arouri et al.,2012; Baillie and Morana,2009;Christensen,2010;Ozdemir et al.,2013).Moreover,DFA-based researches on long memory features in bulk freight market are still inadequate.Therefore,in this paper,we provide DFA results of Baltic Panamax Index(BPD),Baltic Supramax Index(BSI)and Baltic Capesize Index(BCD),which validate the long memory features in bulk freight rate market.The impact of seasonality has also been taken into account in the optimization of DFA. The paper is further organized as follows:Section 2 applies the DFA and ICSS model to analyze of freight rate volatility;Section 3 describes the data used in the long memory test;Section 4 demonstrates the analysis of long memory and structural break of historical data with DFA and ICSS method respectively;Section 5 summaries and concludes 3
3 Recent studies suggested that shocks on volatility have long-lasting effects. This phenomenon is known in the empirical finance literature as long-range dependence behavior or long memory behavior (Charfeddine and Ajmi, 2013). When the effects of volatility shocks decay slowly, long memory in volatility would occur. Significance is attached to the long memory feature, mainly for the sake of its accordance with the presence of nonlinear dependence between observations. Although long memory features have been discussed in many fields, including hydrology, Internet traffic, commodity market and energy future market (Barkoulas et al., 1998; Chen et al., 2006; Crato and Ray, 2000; Elder and Jin, 2007; Ohanissian et al., 2008; Panas, 2001; Wang and Wu, 2012), few researches focus on the long memory feature in freight rate market. As claimed by Yalama and Celik (2013), different financial markets and different sampling periods may present different characteristics of long-range correlation. Therefore, the long memory study focused on freight rate market is indispensable. In this paper, the Detrended Fluctuation Analysis (DFA) method is employed to study the long memory feature of freight rate volatility and the robustness of long-memory inference on daily freight rate index prediction. Compared with other methods which can be used in long memory analysis, such as Rescaled Range Method (R/S) and spectrum analysis method employed in the study of Kai et al.(Kai et al., 2008), an indisputable advantage of DFA is that it can detect the long-range correlations embedded in a non-stationary time series, without being influenced by spurious detection of apparent long-range correlations caused by external trends. The impact of seasonality has also been taken into account in the optimization of DFA , since literatures have shown that freight rate market is seasonal (Kavussanos, 2001, 2002). Additionally, a crucial issue that arises when analyzing the characteristic of long memory is that the existence of structural breaks can have influence on the long memory of freight rate volatility. In spite of the considerable researches that focus on long memory features of volatility, long memory studies on time series with structural breaks are still limited. The Iterated Cumulative Sum of Squares (ICSS) algorithm, which was developed by (Inclan and Tiao, 1994), is proved to be one of the most popular and useful ways in studying the structural transition points of volatility (Aggarwal et al., 1999; Fernández and Aragó, 2003; Malik, 2003; Malik et al., 2005). Thus, ICSS method is adopted in order to detect structural break points in this paper. Studies on freight rate volatility as well as the long memory component and structural breaks have been thoroughly established by plentiful empirical studies (Baillie et al., 2007; Elder and Serletis, 2008; Fernandez, 2010; Wang and Wu, 2012). Nevertheless, tests for potential structural breaks and their impacts on the estimated fractional long memory parameter have been conducted in only a few studies (Arouri et al., 2012; Baillie and Morana, 2009; Christensen, 2010; Ozdemir et al., 2013). Moreover, DFA-based researches on long memory features in bulk freight market are still inadequate. Therefore, in this paper, we provide DFA results of Baltic Panamax Index (BPI), Baltic Supramax Index (BSI) and Baltic Capesize Index (BCI), which validate the long memory features in bulk freight rate market. The impact of seasonality has also been taken into account in the optimization of DFA. The paper is further organized as follows: Section 2 applies the DFA and ICSS model to analyze of freight rate volatility; Section 3 describes the data used in the long memory test; Section 4 demonstrates the analysis of long memory and structural break of historical data with DFA and ICSS method respectively; Section 5 summaries and concludes
Methodology DFA Model The Detrended Fluctuation Analysis(DFA)was first proposed by Peng et al.(1995)while examining series of DNA nucleotides.The DFA method has its intrinsic advantage when analyzing the long-range correlation of time series,since it can effectively eliminate the trend component of in the series,as well as detect the long-range correlation of signals superposed with noise and polynomial trend.Due to the validity of DFA in analysis of the long-range power law correlation of non-stationary time series,we employ this method in our long memory test of bulk freight market.Corresponding to the DFA algorithms with n=1,n=2 and n=3,DFAl,DFA2 and DFA 3 are named separately. ICSS Model The Iterative Cumulative Sums of Squares algorithm(ICSS)was first proposed by (Inclan and Tiao,1994).It owns overwhelming superiority in terms of analysis of structural mutability and detection of structural breaks. This method assumes that the volatility is stationary until an external shock induces a structural change of volatility.After a shock,the volatility becomes stationary again until another structural change occurs.In this paper,this method is employed in order to detect the structural breaks of freight rate index. Data Bulk cargo shipping market is not only one of the most important markets of shipping,but also a global bellwether,signaling industrial health wherever it trades,for bulks are mainly used to transport steel,pulp, grain,coal,iron ore,ore,bauxite and other daily necessities and industrial raw materials.Therefore,we pay great attention to dry bulk index.In the analysis,we choose Supramax,Panamax and Capesize to study the fluctuations in freight rate of dry bulk shipping market since there is an obvious trend of large-scale ship in dry bulk market,and these three kinds of bulks can better reflect the volatility.Baltic Supramax Index(BSI), Baltic Panamax Index(BPI),and Baltic Capesize Index(BCI),which reflect the cost of hiring a vessel across a range of indicative shipping routes,are utilized in the following study. The sample for BPI,BSI and BCI covers the period from July 1st,2005 to February 26th,2015.Fig.I is the line graph of BSI,BPI and BCI in the sample period.The index curves show sharp fluctuations and the indices underwent intensive changes in the year 2008,when the world financial crisis happened
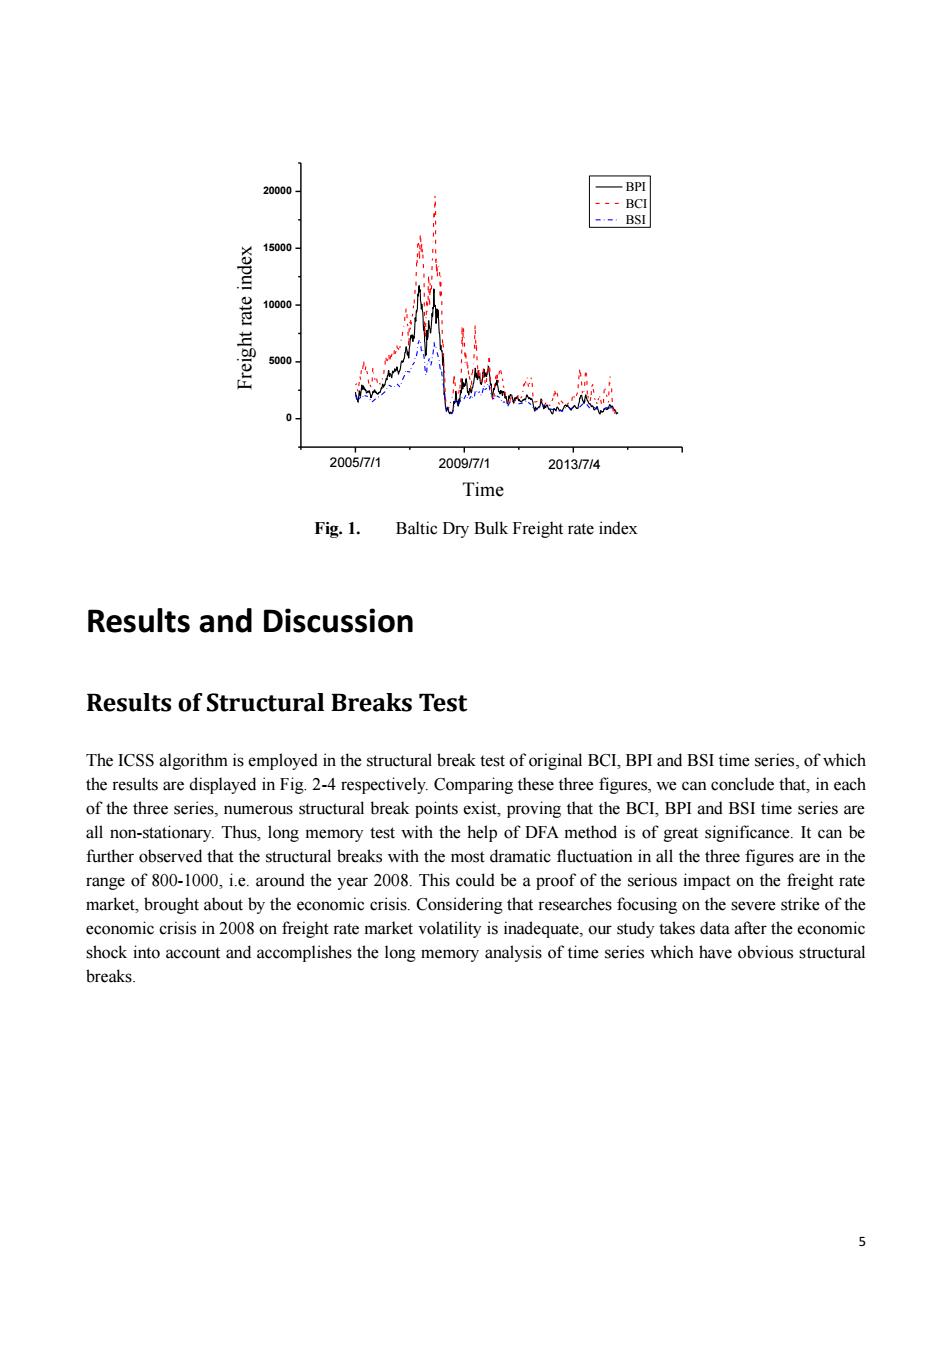
4 Methodology DFA Model The Detrended Fluctuation Analysis (DFA) was first proposed by Peng et al. (1995) while examining series of DNA nucleotides. The DFA method has its intrinsic advantage when analyzing the long-range correlation of time series, since it can effectively eliminate the trend component of in the series, as well as detect the long-range correlation of signals superposed with noise and polynomial trend. Due to the validity of DFA in analysis of the long-range power law correlation of non-stationary time series, we employ this method in our long memory test of bulk freight market. Corresponding to the DFA algorithms with n 1, n 2 and n 3 , DFA1, DFA2 and DFA 3 are named separately. ICSS Model The Iterative Cumulative Sums of Squares algorithm (ICSS) was first proposed by (Inclan and Tiao, 1994). It owns overwhelming superiority in terms of analysis of structural mutability and detection of structural breaks. This method assumes that the volatility is stationary until an external shock induces a structural change of volatility. After a shock, the volatility becomes stationary again until another structural change occurs. In this paper, this method is employed in order to detect the structural breaks of freight rate index. Data Bulk cargo shipping market is not only one of the most important markets of shipping, but also a global bellwether, signaling industrial health wherever it trades, for bulks are mainly used to transport steel, pulp, grain, coal, iron ore, ore, bauxite and other daily necessities and industrial raw materials. Therefore, we pay great attention to dry bulk index. In the analysis, we choose Supramax, Panamax and Capesize to study the fluctuations in freight rate of dry bulk shipping market since there is an obvious trend of large-scale ship in dry bulk market, and these three kinds of bulks can better reflect the volatility. Baltic Supramax Index (BSI), Baltic Panamax Index (BPI), and Baltic Capesize Index (BCI), which reflect the cost of hiring a vessel across a range of indicative shipping routes, are utilized in the following study. The sample for BPI, BSI and BCI covers the period from July 1st, 2005 to February 26th, 2015. Fig. 1 is the line graph of BSI, BPI and BCI in the sample period. The index curves show sharp fluctuations and the indices underwent intensive changes in the year 2008, when the world financial crisis happened
20000 -BPI ---BCI --BSI 15000 10000 5000 2005/7/1 2009/7/1 2013/7/4 Time Fig.1. Baltic Dry Bulk Freight rate index Results and Discussion Results of Structural Breaks Test The ICSS algorithm is employed in the structural break test of original BCI,BPI and BSI time series,of which the results are displayed in Fig.2-4 respectively.Comparing these three figures,we can conclude that,in each of the three series,numerous structural break points exist,proving that the BCI,BPI and BSI time series are all non-stationary.Thus,long memory test with the help of DFA method is of great significance.It can be further observed that the structural breaks with the most dramatic fluctuation in all the three figures are in the range of 800-1000,i.e.around the year 2008.This could be a proof of the serious impact on the freight rate market,brought about by the economic crisis.Considering that researches focusing on the severe strike of the economic crisis in 2008 on freight rate market volatility is inadequate,our study takes data after the economic shock into account and accomplishes the long memory analysis of time series which have obvious structural breaks. 5
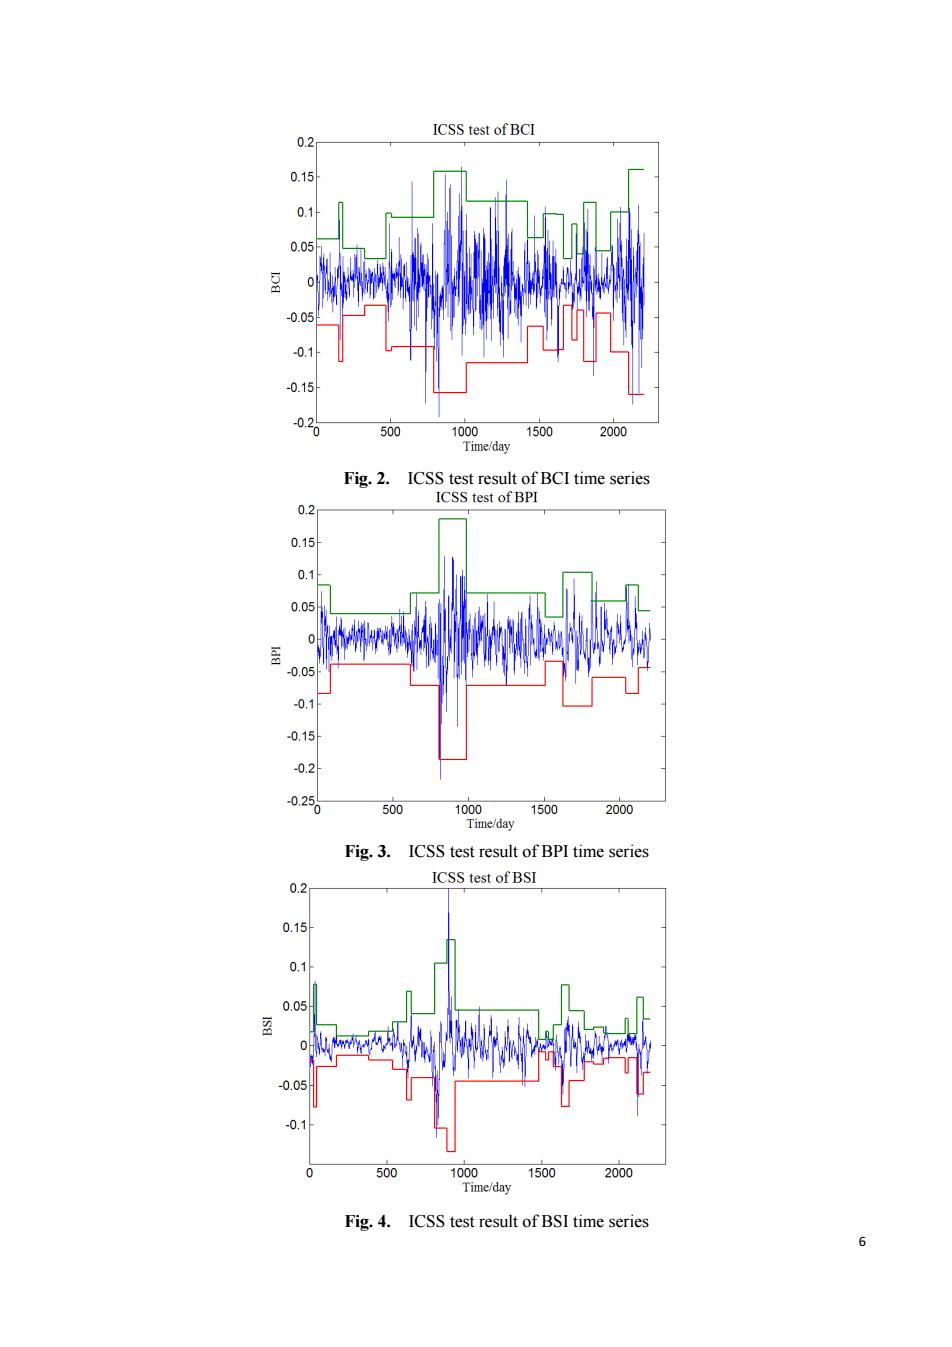
5 0 5000 10000 15000 20000 2009/7/1 2013/7/4 Freight rate index Time BPI BCI BSI 2005/7/1 Fig. 1. Baltic Dry Bulk Freight rate index Results and Discussion Results of Structural Breaks Test The ICSS algorithm is employed in the structural break test of original BCI, BPI and BSI time series, of which the results are displayed in Fig. 2-4 respectively. Comparing these three figures, we can conclude that, in each of the three series, numerous structural break points exist, proving that the BCI, BPI and BSI time series are all non-stationary. Thus, long memory test with the help of DFA method is of great significance. It can be further observed that the structural breaks with the most dramatic fluctuation in all the three figures are in the range of 800-1000, i.e. around the year 2008. This could be a proof of the serious impact on the freight rate market, brought about by the economic crisis. Considering that researches focusing on the severe strike of the economic crisis in 2008 on freight rate market volatility is inadequate, our study takes data after the economic shock into account and accomplishes the long memory analysis of time series which have obvious structural breaks
ICSS test of BCI 0.2 0.15 0.1 0.05 -0.05 0.1 -0.15 02% 500 1000 1500 2000 Time/day Fig.2.ICSS test result of BCI time series ICSS test of BPI 0.2 0.15 0.1 0.05 0.05 0.1 -0.15 -0.2 0250 500 1000 1500 2000 Time/day Fig.3.ICSS test result of BPI time series 0.2 ICSS test of BSI 0.15 0.1 0.05 0.05 -0.1 0 500 1000 1500 2000 Time/day Fig.4.ICSS test result of BSI time series 6
6 Fig. 2. ICSS test result of BCI time series Fig. 3. ICSS test result of BPI time series Fig. 4. ICSS test result of BSI time series
Results of Long Memory Test Comparison between Different DFA methods Results of DFA tests with different orders are shown in Fig.5.The slope of each fitting line means the corresponding scaling exponent a.Obviously,fluctuation function F(s)and time step s present strong logarithmic linear correlation in all the three types of DFA.When comparing the three curves of different orders,we can reach the conclusion that a higher order of DFA will contribute to a more precise fitting of local trend,since the value of F(s)tends to ascend as order of DFA n descends.One can further observe that the difference value between F(s)of neighboring-order DFAs is inclined to decrease as s increases. Different DFA order for BPI DFAI -DEAZ DFA3 3 2 1.0 1.5 20 25 Ig(s) Fig.5. Log-log plot of the fluctuation function with respect to time step(Ig(F(s))vs.Ig(s))in DFAl, DFA2,and DFA3 Table 1.Scaling exponent of different DFA methods Different DFA methods Scaling exponent DFAI 1.10372 DFA2 1.28312 DFA3 1.25539 Seasonal influence Since periodicties can have impact on detection of long memory character,X-12-ARIMA method in Eviews is employed so as to investigate the influence of seasonality in BPI time series.The DFA2 results of original and deseasonalized BPI series are displayed in Fig.3.It can be observed that both time series own strong logarithmic linear correlation between Ig(F(s))and Ig(s),while the slope of the deseasonalized BPI series(1.3)is larger than that of the original BPI series(1.2),indicating that a stronger long-range correlation can still be revealed after
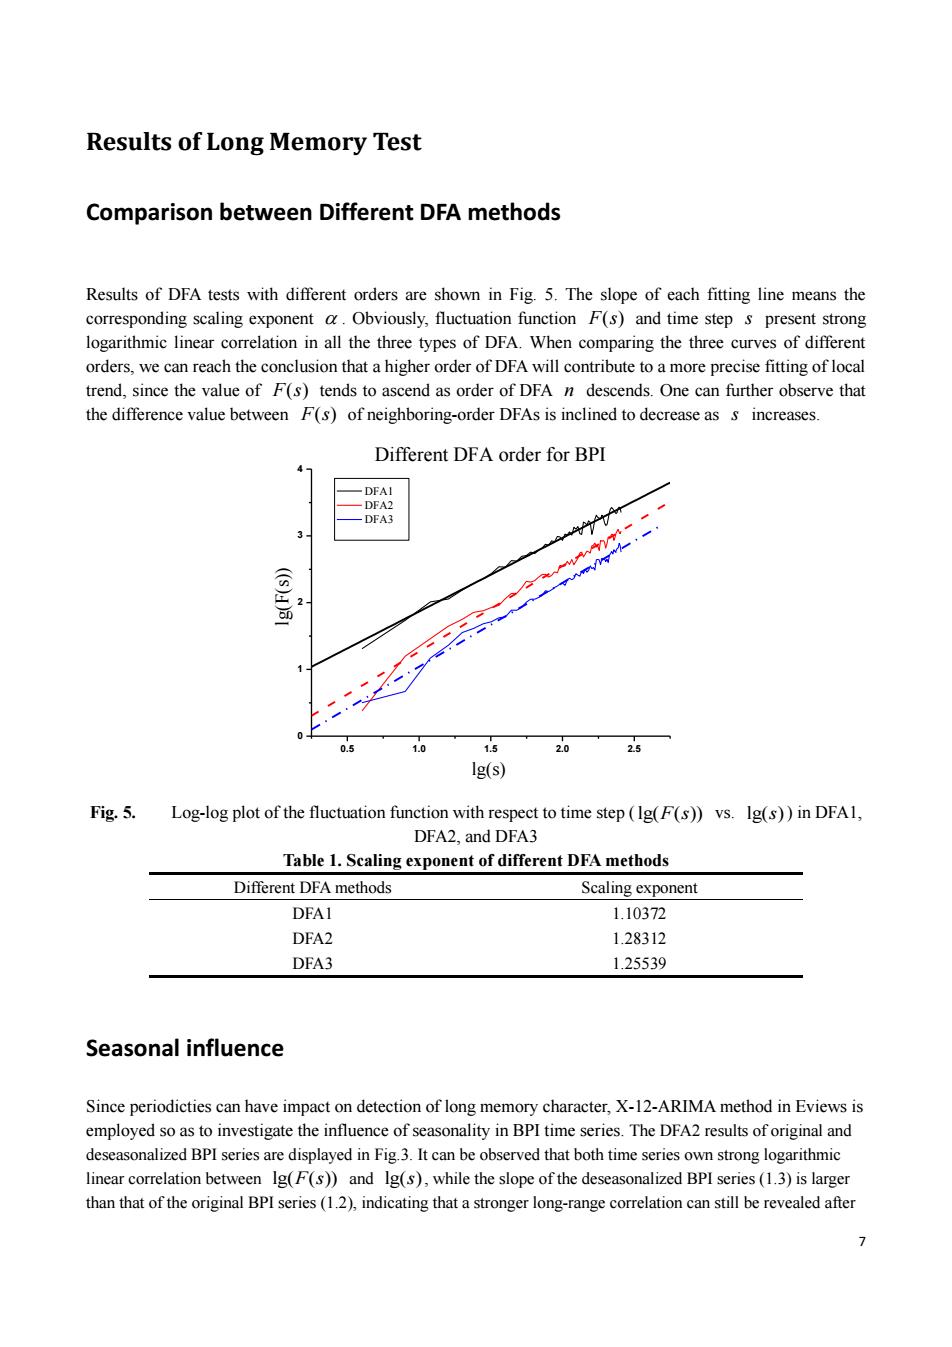
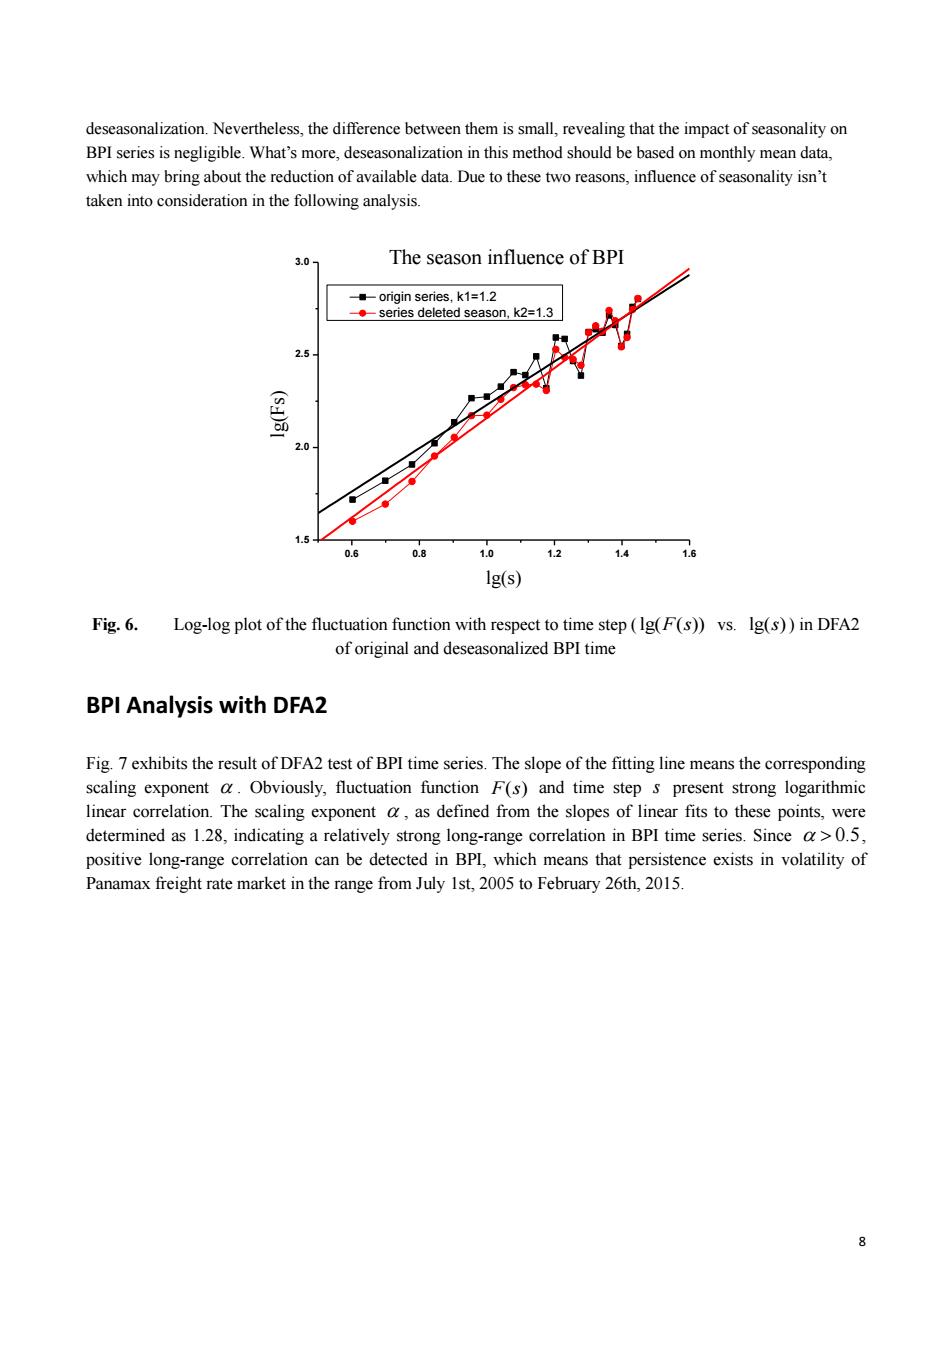
7 Results of Long Memory Test Comparison between Different DFA methods Results of DFA tests with different orders are shown in Fig. 5. The slope of each fitting line means the corresponding scaling exponent . Obviously, fluctuation function F s( ) and time step s present strong logarithmic linear correlation in all the three types of DFA. When comparing the three curves of different orders, we can reach the conclusion that a higher order of DFA will contribute to a more precise fitting of local trend, since the value of F s( ) tends to ascend as order of DFA n descends. One can further observe that the difference value between F s( ) of neighboring-order DFAs is inclined to decrease as s increases. 0.5 1.0 1.5 2.0 2.5 0 1 2 3 4 lg(s) Different DFA order for BPI DFA1 DFA2 DFA3 lg(F(s)) Fig. 5. Log-log plot of the fluctuation function with respect to time step ( lg( ( )) F s vs. lg( )s ) in DFA1, DFA2, and DFA3 Table 1. Scaling exponent of different DFA methods Different DFA methods Scaling exponent DFA1 1.10372 DFA2 1.28312 DFA3 1.25539 Seasonal influence Since periodicties can have impact on detection of long memory character, X-12-ARIMA method in Eviews is employed so as to investigate the influence of seasonality in BPI time series. The DFA2 results of original and deseasonalized BPI series are displayed in Fig.3. It can be observed that both time series own strong logarithmic linear correlation between lg( ( )) F s and lg( )s , while the slope of the deseasonalized BPI series (1.3) is larger than that of the original BPI series (1.2), indicating that a stronger long-range correlation can still be revealed after
deseasonalization.Nevertheless,the difference between them is small,revealing that the impact of seasonality on BPI series is negligible.What's more,deseasonalization in this method should be based on monthly mean data, which may bring about the reduction of available data.Due to these two reasons,influence of seasonality isn't taken into consideration in the following analysis. 3.0 The season influence of BPI --origin series,k1=1.2 --series deleted season,k2=1.3 2.5 (sd) 2.0 1.5 0.6 0.8 1.0 1.2 1.4 16 1g(s) Fig.6.Log-log plot of the fluctuation function with respect to time step(Ig(F(s))vs.Ig(s))in DFA2 of original and deseasonalized BPI time BPI Analysis with DFA2 Fig.7 exhibits the result of DFA2 test of BPI time series.The slope of the fitting line means the corresponding scaling exponent a.Obviously,fluctuation function F(s)and time step s present strong logarithmic linear correlation.The scaling exponent a,as defined from the slopes of linear fits to these points,were determined as 1.28,indicating a relatively strong long-range correlation in BPI time series.Since a>0.5, positive long-range correlation can be detected in BPL,which means that persistence exists in volatility of Panamax freight rate market in the range from July Ist,2005 to February 26th,2015. 8
8 deseasonalization. Nevertheless, the difference between them is small, revealing that the impact of seasonality on BPI series is negligible. What’s more, deseasonalization in this method should be based on monthly mean data, which may bring about the reduction of available data. Due to these two reasons, influence of seasonality isn’t taken into consideration in the following analysis. 0.6 0.8 1.0 1.2 1.4 1.6 1.5 2.0 2.5 3.0 lg(Fs) lg(s) origin series, k1=1.2 series deleted season, k2=1.3 The season influence of BPI Fig. 6. Log-log plot of the fluctuation function with respect to time step ( lg( ( )) F s vs. lg( )s ) in DFA2 of original and deseasonalized BPI time BPI Analysis with DFA2 Fig. 7 exhibits the result of DFA2 test of BPI time series. The slope of the fitting line means the corresponding scaling exponent . Obviously, fluctuation function F s( ) and time step s present strong logarithmic linear correlation. The scaling exponent , as defined from the slopes of linear fits to these points, were determined as 1.28, indicating a relatively strong long-range correlation in BPI time series. Since 0.5, positive long-range correlation can be detected in BPI, which means that persistence exists in volatility of Panamax freight rate market in the range from July 1st, 2005 to February 26th, 2015
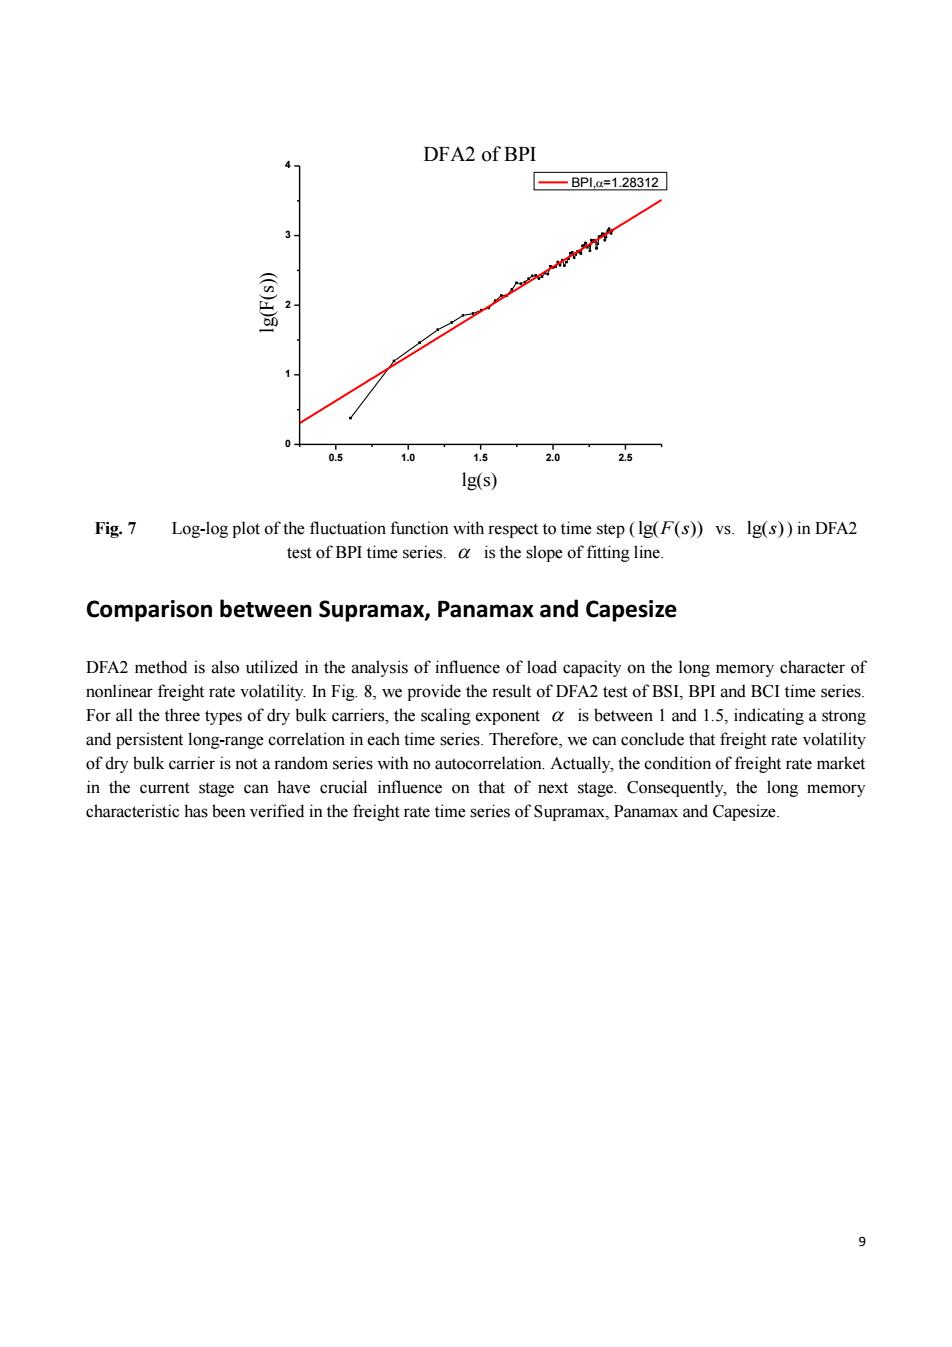
DFA2 of BPI -BP1a=1.28312 3 (s))1 0 0.5 1.0 15 Ig(s) Fig.7 Log-log plot of the fluctuation function with respect to time step(Ig(F(s))vs.Ig(s))in DFA2 test of BPI time series.a is the slope of fitting line. Comparison between Supramax,Panamax and Capesize DFA2 method is also utilized in the analysis of influence of load capacity on the long memory character of nonlinear freight rate volatility.In Fig.8,we provide the result of DFA2 test of BSI,BPI and BCI time series. For all the three types of dry bulk carriers,the scaling exponent a is between I and 1.5,indicating a strong and persistent long-range correlation in each time series.Therefore,we can conclude that freight rate volatility of dry bulk carrier is not a random series with no autocorrelation.Actually,the condition of freight rate market in the current stage can have crucial influence on that of next stage.Consequently,the long memory characteristic has been verified in the freight rate time series of Supramax,Panamax and Capesize. 9
9 0.5 1.0 1.5 2.0 2.5 0 1 2 3 4 DFA2 of BPI lg(s) lg(F(s)) BPI,=1.28312 Fig. 7 Log-log plot of the fluctuation function with respect to time step ( lg( ( )) F s vs. lg( )s ) in DFA2 test of BPI time series. is the slope of fitting line. Comparison between Supramax, Panamax and Capesize DFA2 method is also utilized in the analysis of influence of load capacity on the long memory character of nonlinear freight rate volatility. In Fig. 8, we provide the result of DFA2 test of BSI, BPI and BCI time series. For all the three types of dry bulk carriers, the scaling exponent is between 1 and 1.5, indicating a strong and persistent long-range correlation in each time series. Therefore, we can conclude that freight rate volatility of dry bulk carrier is not a random series with no autocorrelation. Actually, the condition of freight rate market in the current stage can have crucial influence on that of next stage. Consequently, the long memory characteristic has been verified in the freight rate time series of Supramax, Panamax and Capesize
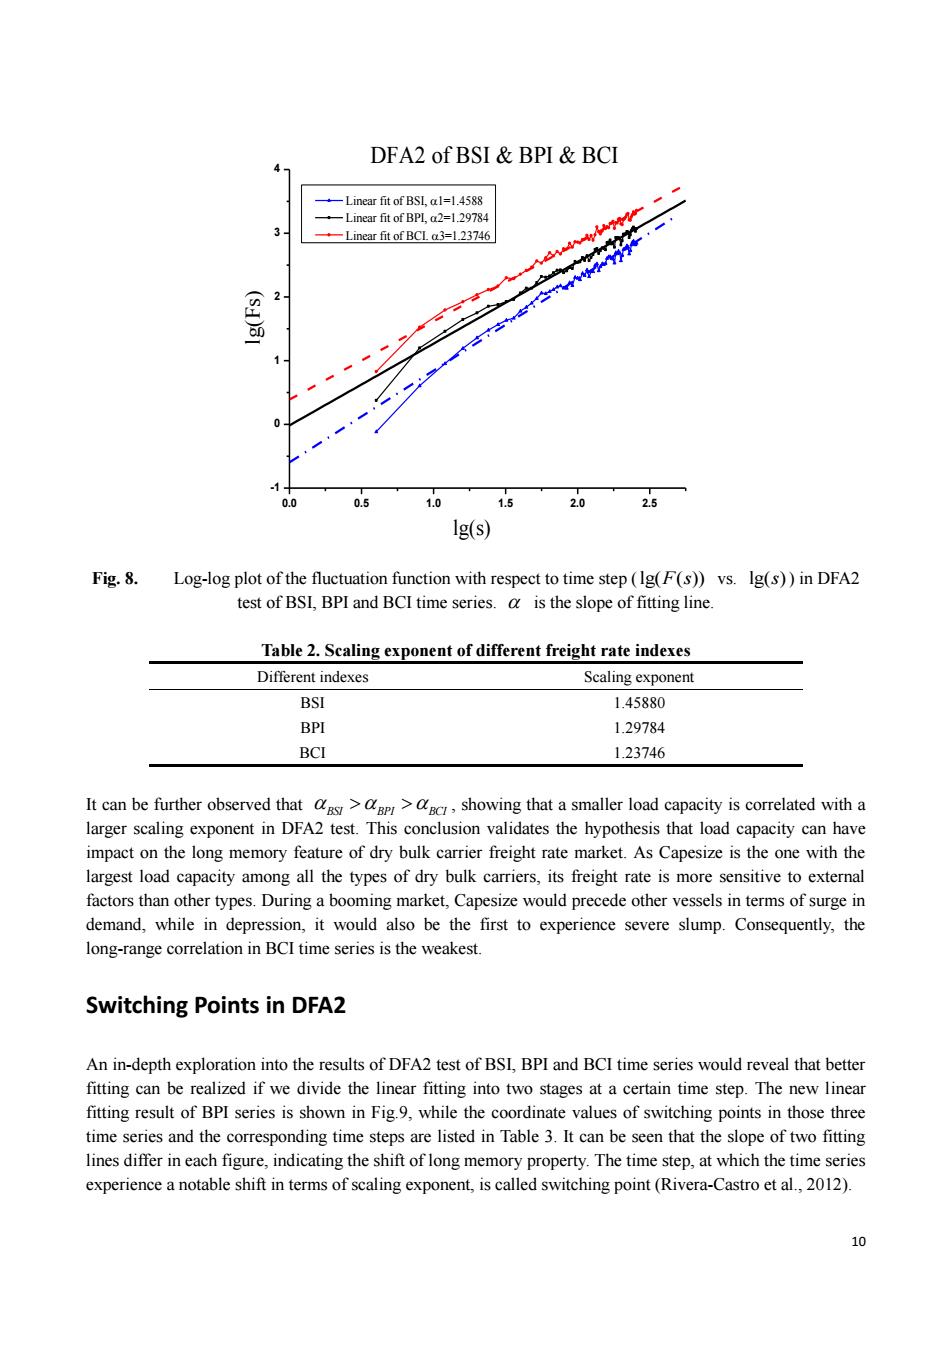
DFA2 of BSI BPI BCI 4 -Linear fit of BSL,al=1.4588 Linear fit of BPL,a2=1.29784 Linear fit of BCL a3=1.23746 (sd) 0 0.0 0.5 1.0 1.5 2.0 2.5 Ig(s) Fig.8. Log-log plot of the fluctuation function with respect to time step(Ig(F(s))vs.Ig(s))in DFA2 test of BSI,BPI and BCI time series.a is the slope of fitting line. Table 2.Scaling exponent of different freight rate indexes Different indexes Scaling exponent BSI 1.45880 BPI 1.29784 BCI 1.23746 It can be further observed that ags>>c,showing that a smaller load capacity is correlated with a larger scaling exponent in DFA2 test.This conclusion validates the hypothesis that load capacity can have impact on the long memory feature of dry bulk carrier freight rate market.As Capesize is the one with the largest load capacity among all the types of dry bulk carriers,its freight rate is more sensitive to external factors than other types.During a booming market,Capesize would precede other vessels in terms of surge in demand,while in depression,it would also be the first to experience severe slump.Consequently,the long-range correlation in BCI time series is the weakest. Switching Points in DFA2 An in-depth exploration into the results of DFA2 test of BSI,BPI and BCI time series would reveal that better fitting can be realized if we divide the linear fitting into two stages at a certain time step.The new linear fitting result of BPI series is shown in Fig.9,while the coordinate values of switching points in those three time series and the corresponding time steps are listed in Table 3.It can be seen that the slope of two fitting lines differ in each figure,indicating the shift of long memory property.The time step,at which the time series experience a notable shift in terms of scaling exponent,is called switching point(Rivera-Castro et al.,2012). 10
10 0.0 0.5 1.0 1.5 2.0 2.5 -1 0 1 2 3 4 lg(s) lg(Fs) DFA2 of BSI & BPI & BCI Linear fit of BSI, 1=1.4588 Linear fit of BPI, 2=1.29784 Linear fit of BCI. 3=1.23746 Fig. 8. Log-log plot of the fluctuation function with respect to time step ( lg( ( )) F s vs. lg( )s ) in DFA2 test of BSI, BPI and BCI time series. is the slope of fitting line. Table 2. Scaling exponent of different freight rate indexes Different indexes Scaling exponent BSI 1.45880 BPI 1.29784 BCI 1.23746 It can be further observed that BSI BPI BCI , showing that a smaller load capacity is correlated with a larger scaling exponent in DFA2 test. This conclusion validates the hypothesis that load capacity can have impact on the long memory feature of dry bulk carrier freight rate market. As Capesize is the one with the largest load capacity among all the types of dry bulk carriers, its freight rate is more sensitive to external factors than other types. During a booming market, Capesize would precede other vessels in terms of surge in demand, while in depression, it would also be the first to experience severe slump. Consequently, the long-range correlation in BCI time series is the weakest. Switching Points in DFA2 An in-depth exploration into the results of DFA2 test of BSI, BPI and BCI time series would reveal that better fitting can be realized if we divide the linear fitting into two stages at a certain time step. The new linear fitting result of BPI series is shown in Fig.9, while the coordinate values of switching points in those three time series and the corresponding time steps are listed in Table 3. It can be seen that the slope of two fitting lines differ in each figure, indicating the shift of long memory property. The time step, at which the time series experience a notable shift in terms of scaling exponent, is called switching point (Rivera-Castro et al., 2012)