
⑧ Academic Communication in English Results 一+m。中一。一 中+
Academic Communication in English Results
③ Results Task 1:Read the research paper of your discipline of study and try to answer the questions: 1.Do researchers write the results and the discussion together or separately?
Results 1. Do researchers write the results and the discussion together or separately? Task 1: Read the research paper of your discipline of study and try to answer the questions:
③ 2.What is typical in the results section,which makes it look different from other parts of the research paper?
2. What is typical in the results section, which makes it look different from other parts of the research paper?
⑧ Results Further exploration 3.Why do writers use either tables or figures to present their research findings?What's the difference?
Results 3. Why do writers use either tables or figures to present their research findings? What’s the difference? Further exploration
Presenting tables and figures Table Figure When working with number shape number/shape When concentrating on individual overall overall pattern/individual data pattern data values values When accurate or precise important less values are important/less important important
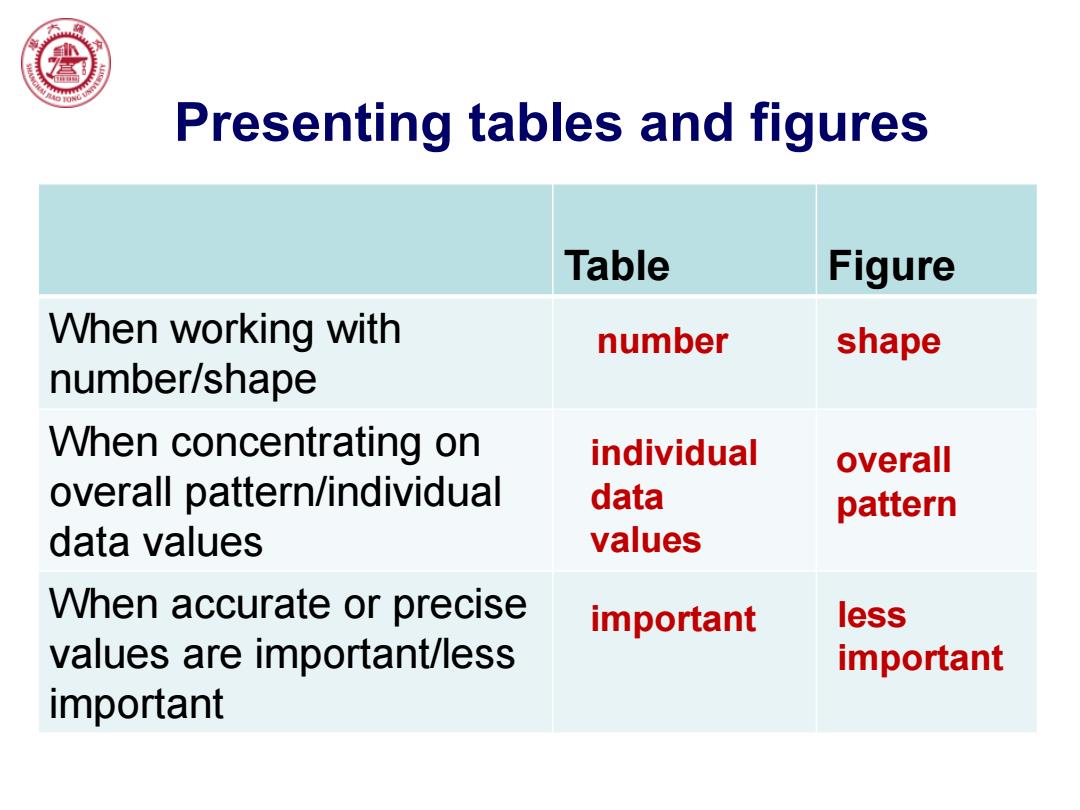
Presenting tables and figures Table Figure When working with number/shape When concentrating on overall pattern/individual data values When accurate or precise values are important/less important important overall pattern shape individual data values number less important
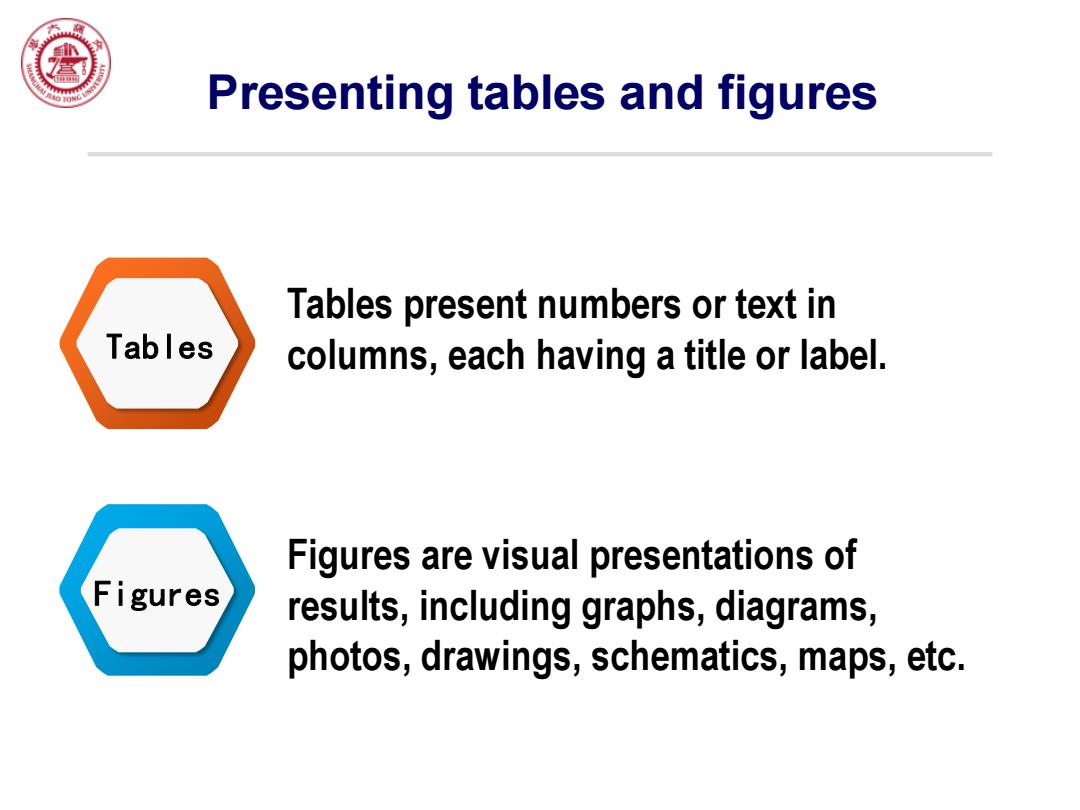
Presenting tables and figures Tables present numbers or text in Tables columns,each having a title or label. Figures are visual presentations of Figures results,including graphs,diagrams, photos,drawings,schematics,maps,etc
Presenting tables and figures Tables Tables present numbers or text in columns, each having a title or label. Figures Figures are visual presentations of results, including graphs, diagrams, photos, drawings, schematics, maps, etc
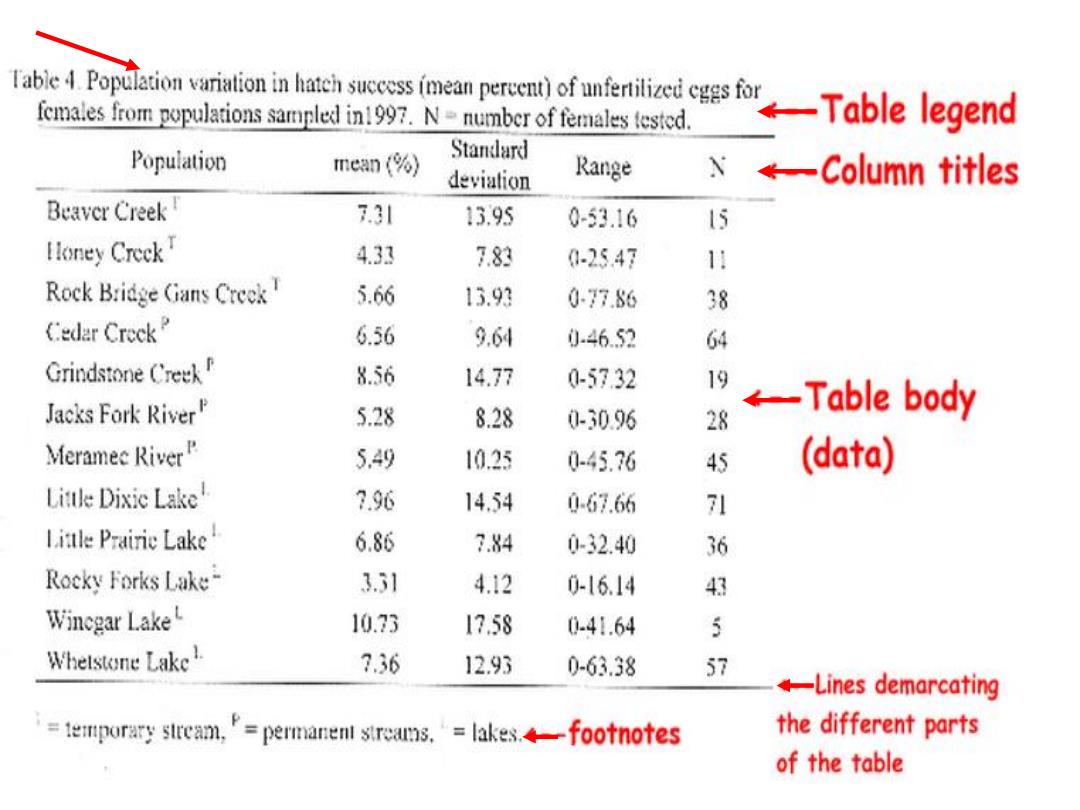
Iabc4PtieionvwniationinlaiemsseosfoeanprerecrwWofunfenizcdcgsfor。←-Tablelegend females from populations sampled in1997.Nnumber of females tested. Population mean(%) Standard deviation Range N←一Column titles Beaver Creek 7.31 13.95 0-53.16 15 Ioney Creck 4.33 7.83 0-25.47 11 Rock Bridge (ians Creck 5.66 13.93 0-77.86 38 Cedar Creck 6.56 9.64 0-46.52 64 Grindstone Creek 8.56 14.77 0-57.32 19 Jacks Fork River 5.28 8.28 ←-Table body 0-3096 28 Meramec RiverP 5.49 10.25 0-45.76 45 (data) Little Dixic Lake 7.96 14.54 0-67.66 71 Litle Prairie Lake 6.86 7.84 0-32.40 36 Rocky Forks Lake- 3.31 4.12 0-16.14 43 Wincgar Lake 10.23 17.58 0-41.64 5 Whetstone Lake 7.36 1293 0-63.38 57 -Lines demarcating =temporary sircam,"permanent streams.lakes.-footnotes the different parts of the table
Company name www.themegaller y.com
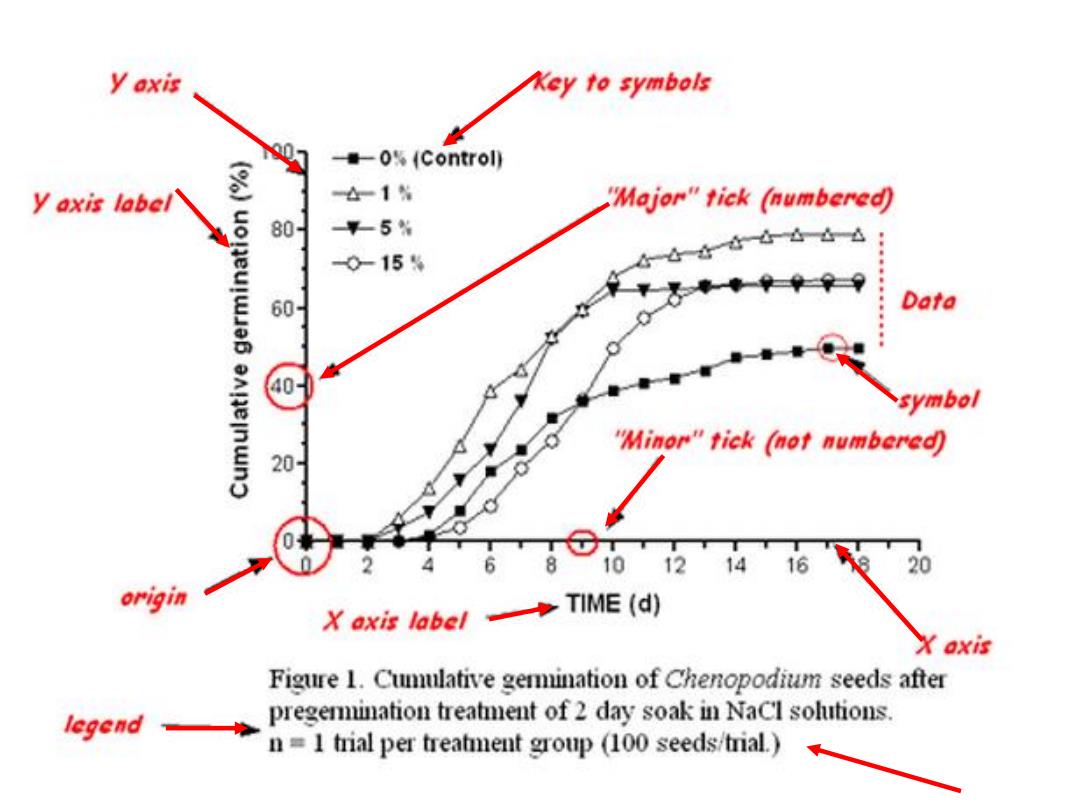
y axis Key to symbols -0%(Control) y axis label 合1% "Major"tick (numbered) 80- 平5% 0-154 60 Data symbol "Minor"tick (not numbered) 20- 10 1214 16 20 X axis label◆l TIME (d) Figure 1.Cumulative germination of Chenopodium seeds after legend pregermiination treatment of 2 day soak in NaCl solutions. n=1 trial per treatment group (100 seeds/trial.)
Company name www.themegaller y.com
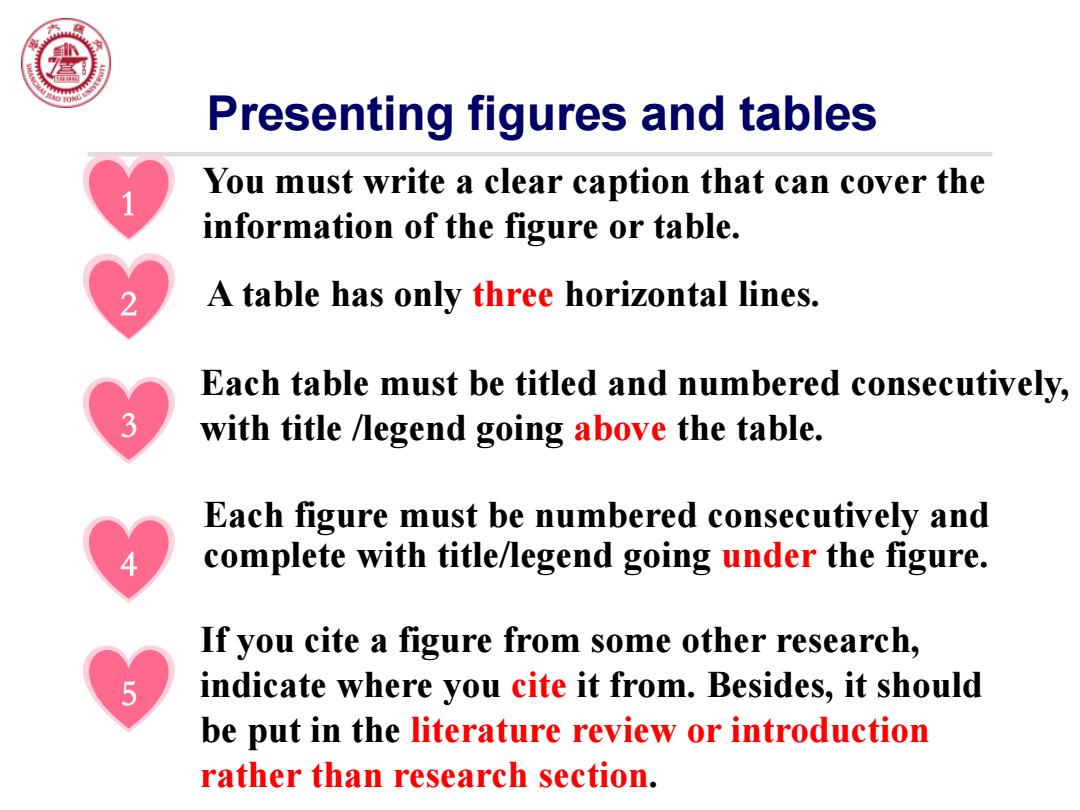
Presenting figures and tables You must write a clear caption that can cover the information of the figure or table. A table has only three horizontal lines. Each table must be titled and numbered consecutively, with title /legend going above the table. Each figure must be numbered consecutively and complete with title/legend going under the figure. If you cite a figure from some other research, indicate where you cite it from.Besides,it should be put in the literature review or introduction rather than research section
Presenting figures and tables A table has only three horizontal lines. Each table must be titled and numbered consecutively, with title /legend going above the table. Each figure must be numbered consecutively and 4 complete with title/legend going under the figure. 3 If you cite a figure from some other research, indicate where you cite it from. Besides, it should be put in the literature review or introduction rather than research section. 5 1 2 You must write a clear caption that can cover the information of the figure or table
⑧ Describing tables and figures Task 3:Please describe and analyze the results in the figure. LASK
Task 3: Please describe and analyze the results in the figure. Describing tables and figures