正在加载图片...
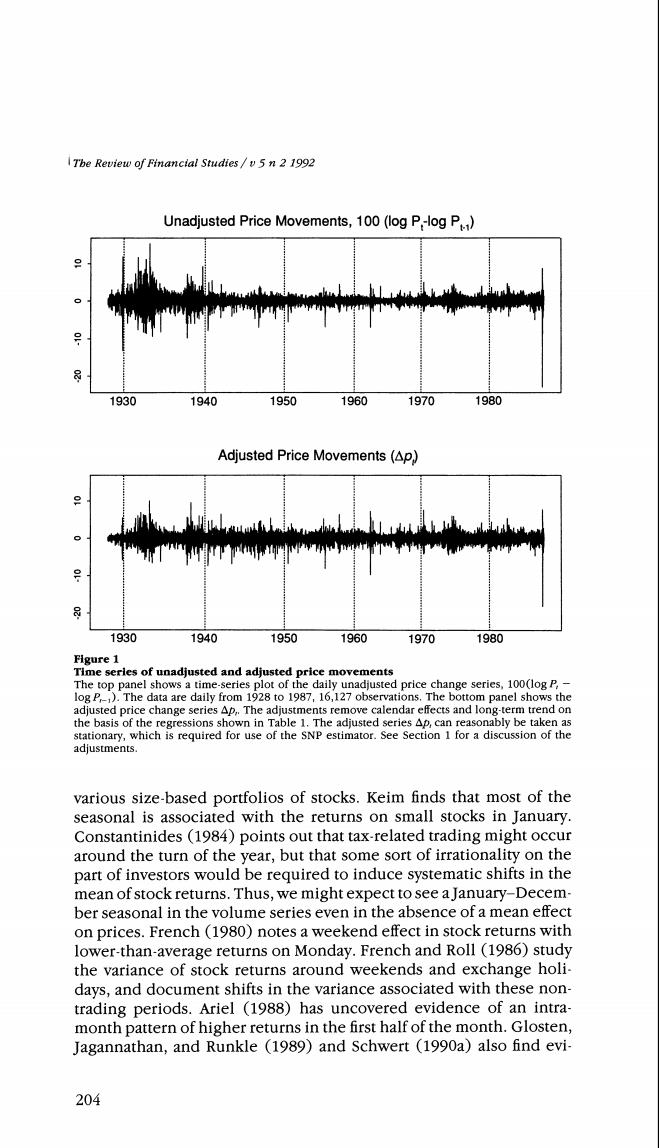
The Review of Financial Studies /v 5 n 2 1992 Unadjusted Price Movements,100(log P-log P) 1930 1940 1950 1960 1970 1980 Adjusted Price Movements(Ap) 1930 1940 1950 1960 1970 1980 Figure 1 Time serles of unadjusted and adjusted price movements The top panel shows a time-series plot of the daily unadjusted price change series,100(log P,- log P).The data are daily from 1928 to 1987,16,127 observations.The bottom panel shows the adjusted price change series Ap,.The adjustments remove calendar effects and long-term trend on the basis of the regressions shown in Table 1.The adjusted series Ap,can reasonably be taken as stationary,which is required for use of the SNP estimator.See Section 1 for a discussion of the adjustments. various size-based portfolios of stocks.Keim finds that most of the seasonal is associated with the returns on small stocks in January. Constantinides (1984)points out that tax-related trading might occur around the turn of the year,but that some sort of irrationality on the part of investors would be required to induce systematic shifts in the mean of stock returns.Thus,we might expect to see a January-Decem- ber seasonal in the volume series even in the absence of a mean effect on prices.French (1980)notes a weekend effect in stock returns with lower-than-average returns on Monday.French and Roll (1986)study the variance of stock returns around weekends and exchange holi- days,and document shifts in the variance associated with these non- trading periods.Ariel (1988)has uncovered evidence of an intra- month pattern of higher returns in the first half of the month.Glosten, Jagannathan,and Runkle (1989)and Schwert (1990a)also find evi- 204