正在加载图片...
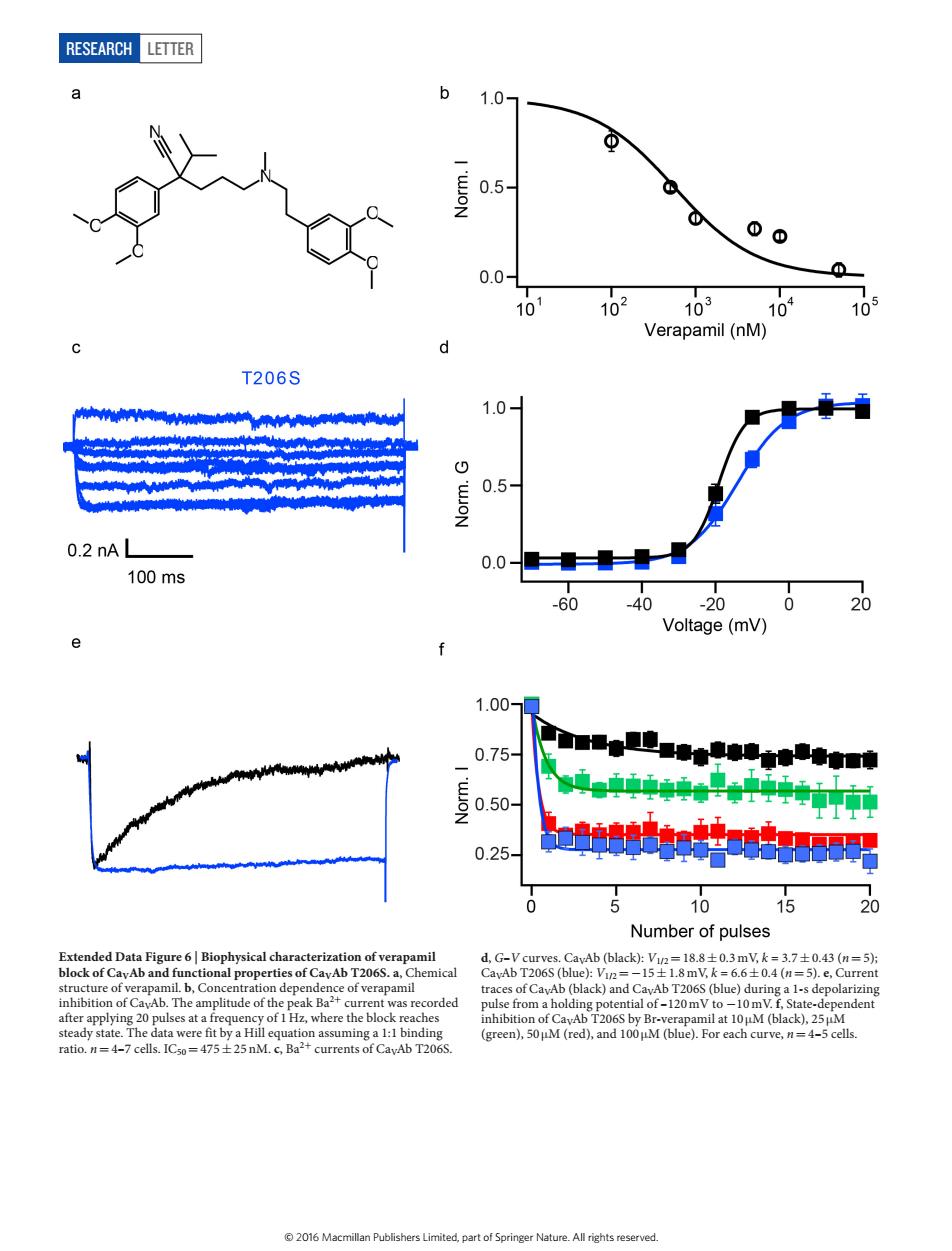
RESEARCH LETTER 1.0- 0.5 00 0.01 103 10 Verapamil(nM) T206S 1.0 0.5 0.2 nA L 0.0 100ms 60 40 0 20 Voltage(mV) 1.00 0.75 .50 0.25 10 15 Number of pulses ical d.curves CavAb (black):.043 () -s depola rded IHz.w RESEARCH Letter Extended Data Figure 6 | Biophysical characterization of verapamil block of CaVAb and functional properties of CaVAb T206S. a, Chemical structure of verapamil. b, Concentration dependence of verapamil inhibition of CaVAb. The amplitude of the peak Ba2+ current was recorded after applying 20 pulses at a frequency of 1Hz, where the block reaches steady state. The data were fit by a Hill equation assuming a 1:1 binding ratio. n=4–7 cells. IC50=475±25 nM. c, Ba2+ currents of CaVAb T206S. d, G–V curves. CaVAb (black): V1/2=18.8±0.3 mV, k = 3.7±0.43 (n=5); CaVAb T206S (blue): V1/2=−15±1.8 mV, k = 6.6±0.4 (n=5). e, Current traces of CaVAb (black) and CaVAb T206S (blue) during a 1-s depolarizing pulse from a holding potential of –120 mV to −10 mV. f, State-dependent inhibition of CaVAb T206S by Br-verapamil at 10 μM (black), 25 μM (green), 50 μM (red), and 100 μM (blue). For each curve, n=4–5 cells. © 2016 Macmillan Publishers Limited, part of Springer Nature. All rights reserved