正在加载图片...
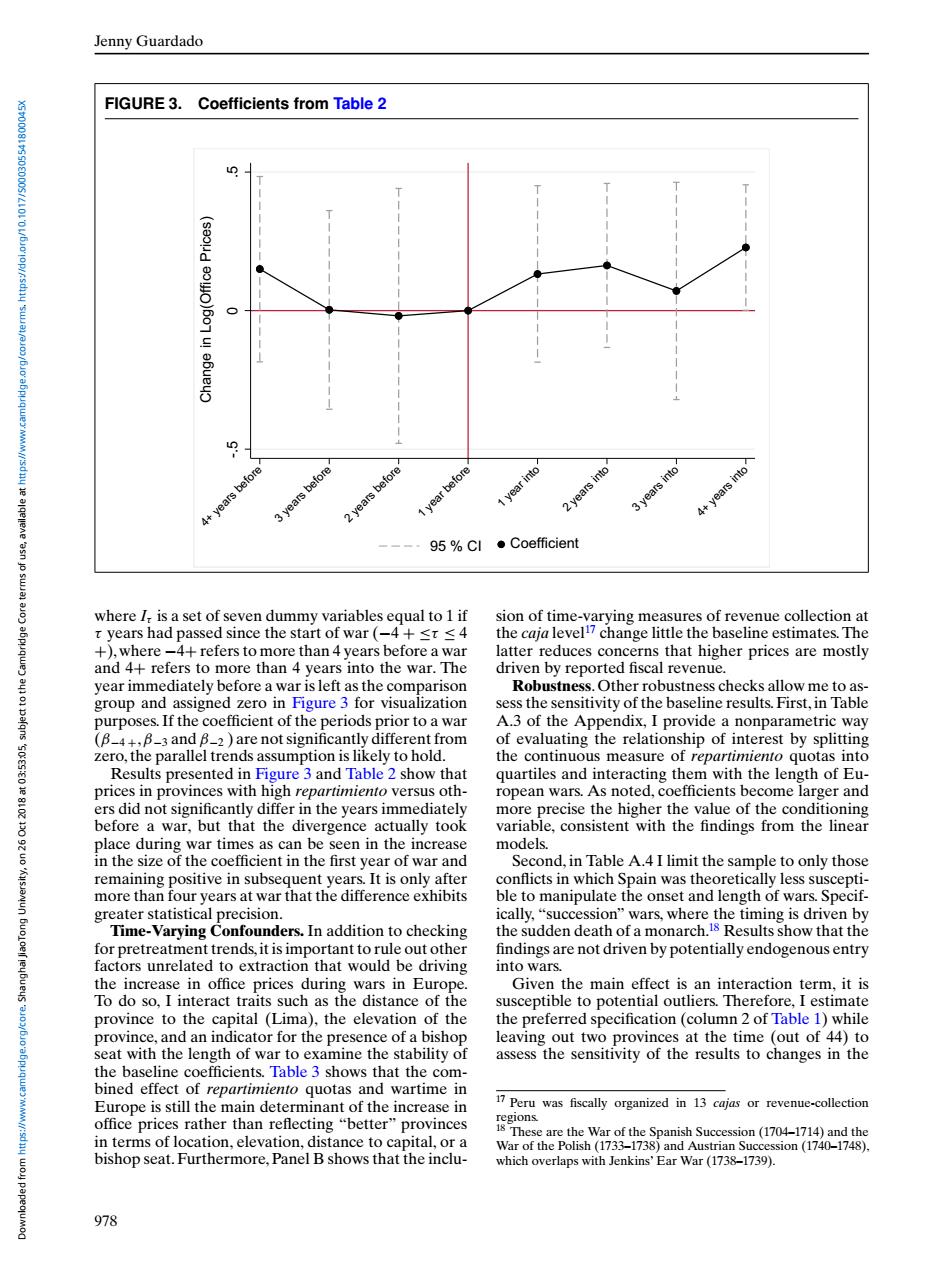
Jenny Guardado FIGURE 3. Coefficients from Table 2 ears before ears before befor into nto ears ear 95%Cl ●Coefficient where I is a set of seven dummy variables equal to 1 if sion of time-varying measures of revenue collection at t years had passed since the start of war(-4+<t <4 the caja level17 change little the baseline estimates.The +)where-4+refers to more than 4 years before a war latter reduces concerns that higher prices are mostly and 4+refers to more than 4 years into the war.The driven by reported fiscal revenue. year immediately before a war is left as the comparison Robustness.Other robustness checks allow me to as- group and assigned zero in Figure 3 for visualization sess the sensitivity of the baseline results.First,in Table purposes.If the coefficient of the periods prior to a war A.3 of the Appendix,I provide a nonparametric way (B-4+,B-3 and B-2)are not significantly different from of evaluating the relationship of interest by splitting 21105.501090 zero,the parallel trends assumption is likely to hold. the continuous measure of repartimiento quotas into Results presented in Figure 3 and Table 2 show that quartiles and interacting them with the length of Eu- prices in provinces with high repartimiento versus oth- ropean wars.As noted,coefficients become larger and ers did not significantly differ in the years immediately more precise the higher the value of the conditioning before a war,but that the divergence actually took variable,consistent with the findings from the linear place during war times as can be seen in the increase models. in the size of the coefficient in the first year of war and Second,in Table A.4 I limit the sample to only those remaining positive in subsequent years.It is only after conflicts in which Spain was theoretically less suscepti- more than four years at war that the difference exhibits ble to manipulate the onset and length of wars.Specif- greater statistical precision. ically,"succession"wars,where the timing is driven by Time-Varying Confounders.In addition to checking the sudden death of a monarch.18 Results show that the for pretreatment trends,it is important to rule out other findings are not driven by potentially endogenous entry factors unrelated to extraction that would be driving into wars. the increase in office prices during wars in Europe. Given the main effect is an interaction term,it is To do so,I interact traits such as the distance of the susceptible to potential outliers.Therefore,I estimate province to the capital (Lima),the elevation of the the preferred specification(column 2 of Table 1)while province,and an indicator for the presence of a bishop leaving out two provinces at the time (out of 44)to seat with the length of war to examine the stability of assess the sensitivity of the results to changes in the the baseline coefficients.Table 3 shows that the com- bined effect of repartimiento quotas and wartime in Europe is still the main determinant of the increase in 17 Peru was fiscally organized in 13 cajas or revenue-collection office prices rather than reflecting"better"provinces hese are the War of the Spanish Succession (1704-1714)and in terms of location,elevation,distance to capital,or a War of the Polish(1733-1738)and Austrian Succession (1740-1748), bishop seat.Furthermore,Panel B shows that the inclu- which overlaps with Jenkins'Ear War(1738-1739). 978Jenny Guardado FIGURE 3. Coefficients from Table 2 -.5 0 .5 Change in Log(Office Prices) 4+ years before 3 years before 2 years before 1 year before 1 year into 2 years into 3 years into 4+ years into 95 % CI Coefficient where Iτ is a set of seven dummy variables equal to 1 if τ years had passed since the start of war (−4 + ≤τ ≤ 4 +), where −4+ refers to more than 4 years before a war and 4+ refers to more than 4 years into the war. The year immediately before a war is left as the comparison group and assigned zero in Figure 3 for visualization purposes. If the coefficient of the periods prior to a war (β−4 +,β−3 and β−2 ) are not significantly different from zero, the parallel trends assumption is likely to hold. Results presented in Figure 3 and Table 2 show that prices in provinces with high repartimiento versus others did not significantly differ in the years immediately before a war, but that the divergence actually took place during war times as can be seen in the increase in the size of the coefficient in the first year of war and remaining positive in subsequent years. It is only after more than four years at war that the difference exhibits greater statistical precision. Time-Varying Confounders. In addition to checking for pretreatment trends,it is important to rule out other factors unrelated to extraction that would be driving the increase in office prices during wars in Europe. To do so, I interact traits such as the distance of the province to the capital (Lima), the elevation of the province, and an indicator for the presence of a bishop seat with the length of war to examine the stability of the baseline coefficients. Table 3 shows that the combined effect of repartimiento quotas and wartime in Europe is still the main determinant of the increase in office prices rather than reflecting “better” provinces in terms of location, elevation, distance to capital, or a bishop seat. Furthermore, Panel B shows that the inclusion of time-varying measures of revenue collection at the caja level17 change little the baseline estimates. The latter reduces concerns that higher prices are mostly driven by reported fiscal revenue. Robustness.Other robustness checks allow me to assess the sensitivity of the baseline results. First, in Table A.3 of the Appendix, I provide a nonparametric way of evaluating the relationship of interest by splitting the continuous measure of repartimiento quotas into quartiles and interacting them with the length of European wars. As noted, coefficients become larger and more precise the higher the value of the conditioning variable, consistent with the findings from the linear models. Second, in Table A.4 I limit the sample to only those conflicts in which Spain was theoretically less susceptible to manipulate the onset and length of wars. Specifically, “succession” wars, where the timing is driven by the sudden death of a monarch.18 Results show that the findings are not driven by potentially endogenous entry into wars. Given the main effect is an interaction term, it is susceptible to potential outliers. Therefore, I estimate the preferred specification (column 2 of Table 1) while leaving out two provinces at the time (out of 44) to assess the sensitivity of the results to changes in the 17 Peru was fiscally organized in 13 cajas or revenue-collection regions. 18 These are the War of the Spanish Succession (1704–1714) and the War of the Polish (1733–1738) and Austrian Succession (1740–1748), which overlaps with Jenkins’ Ear War (1738–1739). 978 Downloaded from https://www.cambridge.org/core. Shanghai JiaoTong University, on 26 Oct 2018 at 03:53:05, subject to the Cambridge Core terms of use, available at https://www.cambridge.org/core/terms. https://doi.org/10.1017/S000305541800045X