正在加载图片...
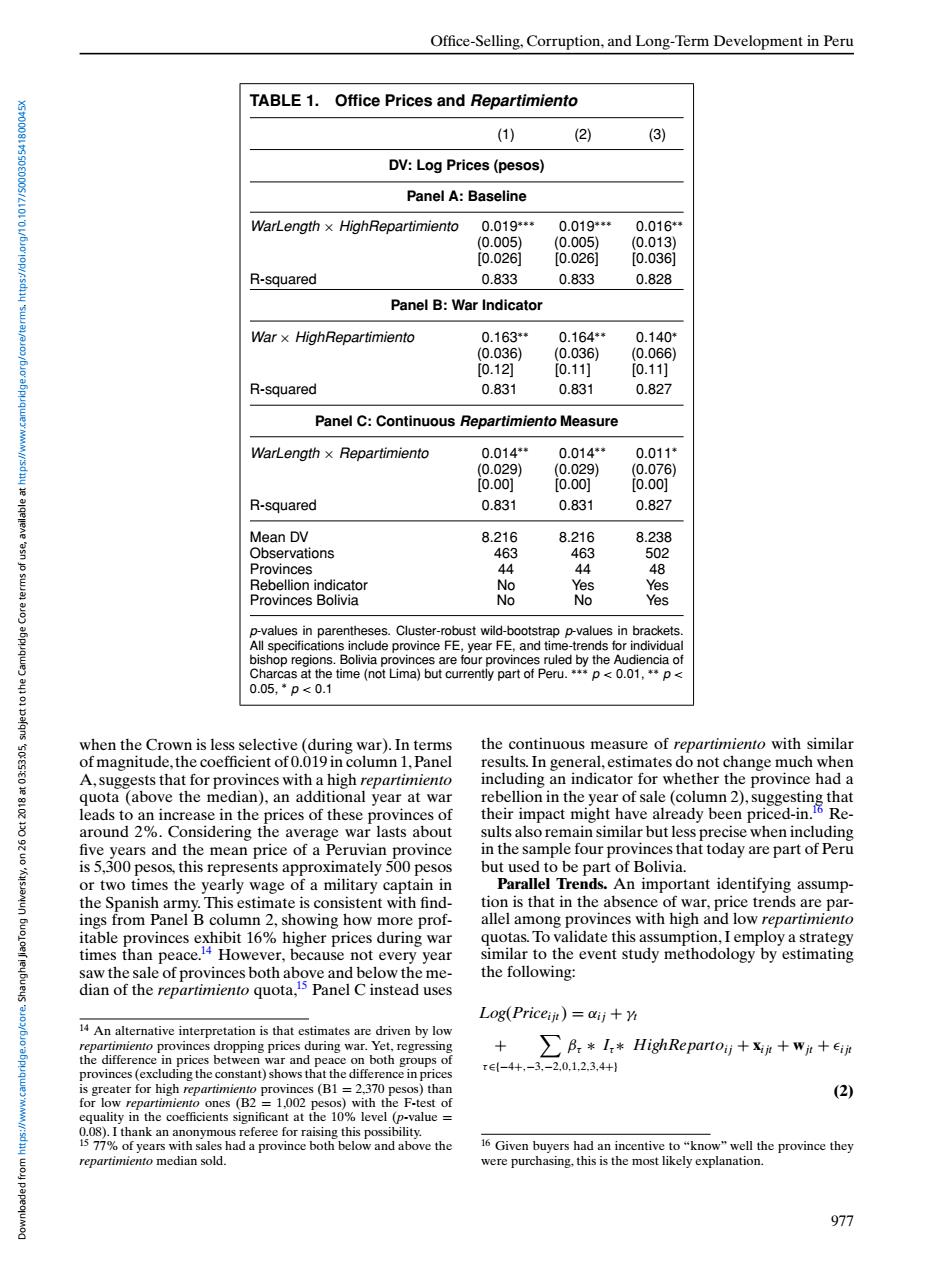
Office-Selling,Corruption,and Long-Term Development in Peru TABLE 1.Office Prices and Repartimiento (1) (2) (3) DV:Log Prices(pesos) Panel A:Baseline WarLength x HighRepartimiento 0.019** 0.019** 0.016* (0.005) (0.005) (0.013) 0.0261 [0.0261 [0.0361 R-squared 0.833 0.833 0.828 Panel B:War Indicator War x HighRepartimiento 0.163* 0.164* 0.140* (0.036) (0.036) (0.066) [0.12] [0.11 [0.11] R-squared 0.831 0.831 0.827 Panel C:Continuous Repartimiento Measure WarLength x Repartimiento 0.014* 0.014* 0.011* (0.029) (0.029) (0.076) i0.0o1 i0.0o] i0.0o] R-squared 0.831 0.831 0.827 Mean DV 8.216 8.216 8.238 Observations 463 463 502 Provinces 44 44 48 Rebellion indicator No Yes Yes Provinces Bolivia No No Yes p-values in parentheses.Cluster-robust wild-bootstrap p-values in brackets All specifications include province FE,year FE,and time-trends for individual bishop regions.Bolivia provinces are four provinces ruled by the Audiencia of Charcas at the time (not Lima)but currently part of Peru.***p<0.01,**p< 0.05,p<0.1 when the Crown is less selective (during war).In terms the continuous measure of repartimiento with similar of magnitude,the coefficient of 0.019 in column 1.Panel results.In general,estimates do not change much when A,suggests that for provinces with a high repartimiento including an indicator for whether the province had a quota (above the median),an additional year at war rebellion in the year of sale(column 2),suggesting that leads to an increase in the prices of these provinces of their impact might have already been priced-in.6 Re- around 2%.Considering the average war lasts about sults also remain similar but less precise when including five years and the mean price of a Peruvian province in the sample four provinces that today are part of Peru is 5,300 pesos,this represents approximately 500 pesos but used to be part of Bolivia. or two times the yearly wage of a military captain in Parallel Trends.An important identifying assump- the Spanish army.This estimate is consistent with find- tion is that in the absence of war.price trends are par- ings from Panel B column 2,showing how more prof- allel among provinces with high and low repartimiento itable provinces exhibit 16%higher prices during war quotas.To validate this assumption,I employ a strategy times than peace.14 However,because not every year similar to the event study methodology by estimating saw the sale of provinces both above and below the me- the following: dian of the repartimiento quota,s Panel C instead uses Log(Priceiit)=aij+y 14 An alternative interpretation is that estimates are driven by low repartimiento provinces dropping prices during war.Yet,regressing B*I*HighRepartoij +xii+wit+eijt the difference in prices between war and peace on both groups of te{-4+,-3.-2,0.1.2.3,4+} provinces(excluding the constant)shows that the difference in prices is greater for high repartimiento provinces(B1=2.370 pesos)than (2) for low repartimiento ones (B2 =1,002 pesos)with the F-test of equality in the coefficients significant at the 10%level (p-value 0.08).I thank an anonymous referee for raising this possibility. 1577%of years with sales had a province both below and above the 16 Given buyers had an incentive to"know"well the province they repartimiento median sold. were purchasing,this is the most likely explanation. 977Office-Selling, Corruption, and Long-Term Development in Peru TABLE 1. Office Prices and Repartimiento (1) (2) (3) DV: Log Prices (pesos) Panel A: Baseline WarLength × HighRepartimiento 0.019∗∗∗ 0.019∗∗∗ 0.016∗∗ (0.005) (0.005) (0.013) [0.026] [0.026] [0.036] R-squared 0.833 0.833 0.828 Panel B: War Indicator War × HighRepartimiento 0.163∗∗ 0.164∗∗ 0.140∗ (0.036) (0.036) (0.066) [0.12] [0.11] [0.11] R-squared 0.831 0.831 0.827 Panel C: Continuous Repartimiento Measure WarLength × Repartimiento 0.014∗∗ 0.014∗∗ 0.011∗ (0.029) (0.029) (0.076) [0.00] [0.00] [0.00] R-squared 0.831 0.831 0.827 Mean DV 8.216 8.216 8.238 Observations 463 463 502 Provinces 44 44 48 Rebellion indicator No Yes Yes Provinces Bolivia No No Yes p-values in parentheses. Cluster-robust wild-bootstrap p-values in brackets. All specifications include province FE, year FE, and time-trends for individual bishop regions. Bolivia provinces are four provinces ruled by the Audiencia of Charcas at the time (not Lima) but currently part of Peru. ∗∗∗ p < 0.01, ∗∗ p < 0.05, ∗ p < 0.1 when the Crown is less selective (during war). In terms of magnitude, the coefficient of 0.019 in column 1,Panel A, suggests that for provinces with a high repartimiento quota (above the median), an additional year at war leads to an increase in the prices of these provinces of around 2%. Considering the average war lasts about five years and the mean price of a Peruvian province is 5,300 pesos, this represents approximately 500 pesos or two times the yearly wage of a military captain in the Spanish army. This estimate is consistent with findings from Panel B column 2, showing how more profitable provinces exhibit 16% higher prices during war times than peace.14 However, because not every year saw the sale of provinces both above and below the median of the repartimiento quota,15 Panel C instead uses 14 An alternative interpretation is that estimates are driven by low repartimiento provinces dropping prices during war. Yet, regressing the difference in prices between war and peace on both groups of provinces (excluding the constant) shows that the difference in prices is greater for high repartimiento provinces (B1 = 2,370 pesos) than for low repartimiento ones (B2 = 1,002 pesos) with the F-test of equality in the coefficients significant at the 10% level (p-value = 0.08). I thank an anonymous referee for raising this possibility. 15 77% of years with sales had a province both below and above the repartimiento median sold. the continuous measure of repartimiento with similar results. In general, estimates do not change much when including an indicator for whether the province had a rebellion in the year of sale (column 2), suggesting that their impact might have already been priced-in.16 Results also remain similar but less precise when including in the sample four provinces that today are part of Peru but used to be part of Bolivia. Parallel Trends. An important identifying assumption is that in the absence of war, price trends are parallel among provinces with high and low repartimiento quotas. To validate this assumption, I employ a strategy similar to the event study methodology by estimating the following: Log(Pricei jt) = αi j + γt + τ∈{−4+,−3,−2,0,1,2,3,4+} βτ ∗ Iτ ∗ HighRepartoi j + xi jt + wjt + i jt (2) 16 Given buyers had an incentive to “know” well the province they were purchasing, this is the most likely explanation. 977 Downloaded from https://www.cambridge.org/core. Shanghai JiaoTong University, on 26 Oct 2018 at 03:53:05, subject to the Cambridge Core terms of use, available at https://www.cambridge.org/core/terms. https://doi.org/10.1017/S000305541800045X�