正在加载图片...
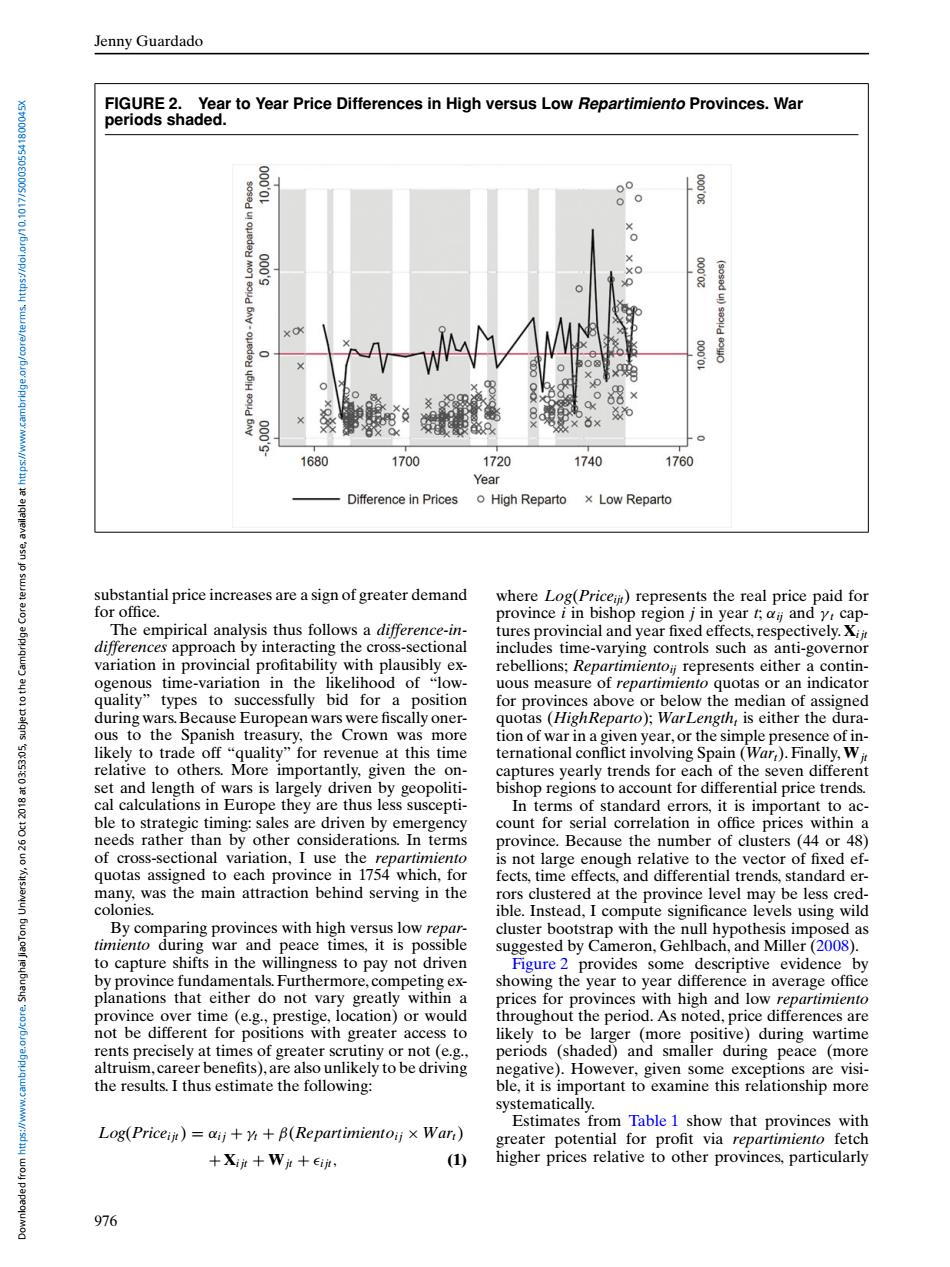
Jenny Guardado FIGURE 2.Year to Year Price Differences in High versus Low Repartimiento Provinces.War periods shaded. 00 0 0 000.5 + r● 1680 1700 1720 1740 1760 Year Difference in Prices o High Reparto x Low Reparto substantial price increases are a sign of greater demand where Log(Pricei)represents the real price paid for for office. province i in bishop region j in year t;a and y cap- The empirical analysis thus follows a difference-in- tures provincial and year fixed effects,respectively.Xij differences approach by interacting the cross-sectional includes time-varying controls such as anti-governor variation in provincial profitability with plausibly ex- rebellions;Repartimientoi represents either a contin- ogenous time-variation in the likelihood of "low- uous measure of repartimiento quotas or an indicator quality"types to successfully bid for a position for provinces above or below the median of assigned during wars.Because European wars were fiscally oner- quotas (HighReparto);WarLength,is either the dura- ous to the Spanish treasury,the Crown was more tion of war in a given year,or the simple presence of in- 115.5010 likely to trade off "quality"for revenue at this time ternational conflict involving Spain (War,).Finally,Wit relative to others.More importantly,given the on- captures yearly trends for each of the seven different set and length of wars is largely driven by geopoliti- bishop regions to account for differential price trends. cal calculations in Europe they are thus less suscepti- In terms of standard errors,it is important to ac- ble to strategic timing:sales are driven by emergency count for serial correlation in office prices within a needs rather than by other considerations.In terms province.Because the number of clusters (44 or 48) of cross-sectional variation,I use the repartimiento is not large enough relative to the vector of fixed ef- quotas assigned to each province in 1754 which,for fects,time effects,and differential trends,standard er- many,was the main attraction behind serving in the rors clustered at the province level may be less cred- colonies. ible.Instead,I compute significance levels using wild By comparing provinces with high versus low repar- cluster bootstrap with the null hypothesis imposed as timiento during war and peace times,it is possible suggested by Cameron,Gehlbach,and Miller(2008). to capture shifts in the willingness to pay not driven Figure 2 provides some descriptive evidence by by province fundamentals.Furthermore,competing ex- showing the year to year difference in average office planations that either do not vary greatly within a prices for provinces with high and low repartimiento province over time (e.g.,prestige,location)or would throughout the period.As noted,price differences are not be different for positions with greater access to likely to be larger (more positive)during wartime rents precisely at times of greater scrutiny or not (e.g., periods (shaded)and smaller during peace (more altruism,career benefits),are also unlikely to be driving negative).However,given some exceptions are visi- the results.I thus estimate the following: ble,it is important to examine this relationship more systematically. Estimates from Table 1 show that provinces with Log(Priceiit)=aij+y+B(Repartimientoij x War) greater potential for profit via repartimiento fetch +Xiit +Wit+eiit, 1) higher prices relative to other provinces,particularly 976Jenny Guardado FIGURE 2. Year to Year Price Differences in High versus Low Repartimiento Provinces. War periods shaded. substantial price increases are a sign of greater demand for office. The empirical analysis thus follows a difference-indifferences approach by interacting the cross-sectional variation in provincial profitability with plausibly exogenous time-variation in the likelihood of “lowquality” types to successfully bid for a position during wars.Because European wars were fiscally onerous to the Spanish treasury, the Crown was more likely to trade off “quality” for revenue at this time relative to others. More importantly, given the onset and length of wars is largely driven by geopolitical calculations in Europe they are thus less susceptible to strategic timing: sales are driven by emergency needs rather than by other considerations. In terms of cross-sectional variation, I use the repartimiento quotas assigned to each province in 1754 which, for many, was the main attraction behind serving in the colonies. By comparing provinces with high versus low repartimiento during war and peace times, it is possible to capture shifts in the willingness to pay not driven by province fundamentals. Furthermore, competing explanations that either do not vary greatly within a province over time (e.g., prestige, location) or would not be different for positions with greater access to rents precisely at times of greater scrutiny or not (e.g., altruism, career benefits), are also unlikely to be driving the results. I thus estimate the following: Log(Pricei jt) = αi j + γt + β(Repartimientoi j × Wart) + Xi jt + Wjt + i jt, (1) where Log(Priceijt) represents the real price paid for province i in bishop region j in year t; αij and γ t captures provincial and year fixed effects, respectively. Xi jt includes time-varying controls such as anti-governor rebellions; Repartimientoij represents either a continuous measure of repartimiento quotas or an indicator for provinces above or below the median of assigned quotas (HighReparto); WarLengtht is either the duration of war in a given year, or the simple presence of international conflict involving Spain (Wart). Finally, Wjt captures yearly trends for each of the seven different bishop regions to account for differential price trends. In terms of standard errors, it is important to account for serial correlation in office prices within a province. Because the number of clusters (44 or 48) is not large enough relative to the vector of fixed effects, time effects, and differential trends, standard errors clustered at the province level may be less credible. Instead, I compute significance levels using wild cluster bootstrap with the null hypothesis imposed as suggested by Cameron, Gehlbach, and Miller (2008). Figure 2 provides some descriptive evidence by showing the year to year difference in average office prices for provinces with high and low repartimiento throughout the period. As noted, price differences are likely to be larger (more positive) during wartime periods (shaded) and smaller during peace (more negative). However, given some exceptions are visible, it is important to examine this relationship more systematically. Estimates from Table 1 show that provinces with greater potential for profit via repartimiento fetch higher prices relative to other provinces, particularly 976 Downloaded from https://www.cambridge.org/core. Shanghai JiaoTong University, on 26 Oct 2018 at 03:53:05, subject to the Cambridge Core terms of use, available at https://www.cambridge.org/core/terms. https://doi.org/10.1017/S000305541800045X