正在加载图片...
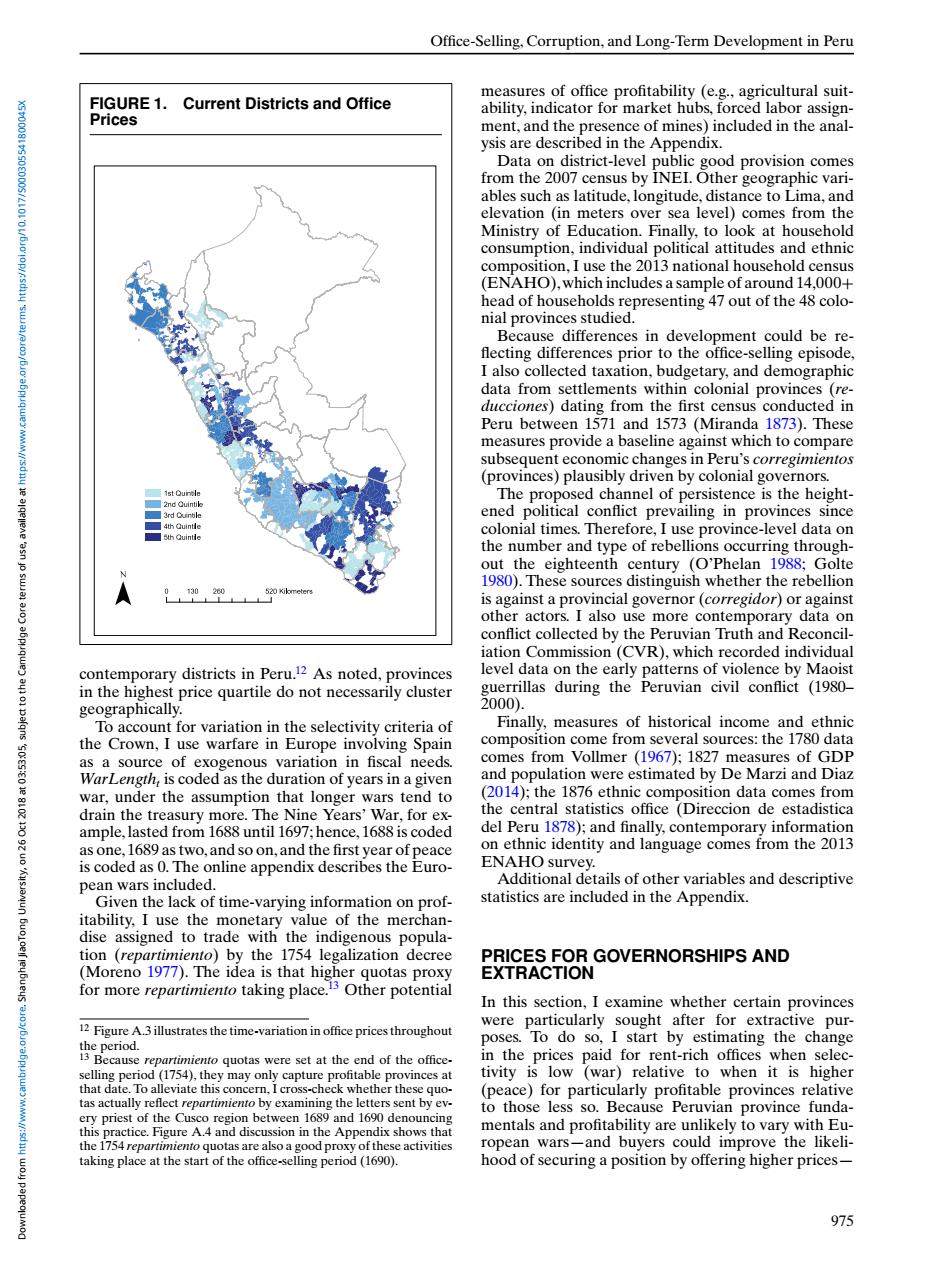
Office-Selling,Corruption,and Long-Term Development in Peru FIGURE 1.Current Districts and Office measures of office profitability (e.g.,agricultural suit- ability,indicator for market hubs,forced labor assign- Prices ment,and the presence of mines)included in the anal- ysis are described in the Appendix. Data on district-level public good provision comes from the 2007 census by INEI.Other geographic vari- ables such as latitude,longitude,distance to Lima,and elevation (in meters over sea level)comes from the Ministry of Education.Finally,to look at household consumption,individual political attitudes and ethnic composition,I use the 2013 national household census (ENAHO),which includes a sample of around 14,000+ head of households representing 47 out of the 48 colo- nial provinces studied. Because differences in development could be re- flecting differences prior to the office-selling episode, I also collected taxation,budgetary,and demographic data from settlements within colonial provinces (re- ducciones)dating from the first census conducted in Peru between 1571 and 1573(Miranda 1873).These measures provide a baseline against which to compare subsequent economic changes in Peru's corregimientos (provinces)plausibly driven by colonial governors. The proposed channel of persistence is the height- ened political conflict prevailing in provinces since colonial times.Therefore,I use province-level data on the number and type of rebellions occurring through- out the eighteenth century (O'Phelan 1988;Golte 1980).These sources distinguish whether the rebellion 30 is against a provincial governor(corregidor)or against other actors.I also use more contemporary data on conflict collected by the Peruvian Truth and Reconcil- iation Commission(CVR),which recorded individual contemporary districts in Peru.12 As noted,provinces level data on the early patterns of violence by Maoist in the highest price quartile do not necessarily cluster guerrillas during the Peruvian civil conflict (1980- geographically. 2000). To account for variation in the selectivity criteria of Finally,measures of historical income and ethnic the Crown,I use warfare in Europe involving Spain composition come from several sources:the 1780 data 235.5010 as a source of exogenous variation in fiscal needs comes from Vollmer (1967);1827 measures of GDP WarLength,is coded as the duration of years in a given and population were estimated by De Marzi and Diaz war,under the assumption that longer wars tend to (2014);the 1876 ethnic composition data comes from drain the treasury more.The Nine Years'War,for ex- the central statistics office (Direccion de estadistica ample,lasted from 1688 until 1697;hence,1688 is coded del Peru 1878);and finally,contemporary information as one,1689 as two,and so on,and the first year of peace on ethnic identity and language comes from the 2013 is coded as 0.The online appendix describes the Euro- ENAHO survey. pean wars included. Additional details of other variables and descriptive Given the lack of time-varying information on prof- statistics are included in the Appendix. itability,I use the monetary value of the merchan- dise assigned to trade with the indigenous popula- tion (repartimiento)by the 1754 legalization decree PRICES FOR GOVERNORSHIPS AND (Moreno 1977).The idea is that higher quotas proxy EXTRACTION for more repartimiento taking place.3 Other potential In this section,I examine whether certain provinces 12 Figure A.3illustrates the time-variation inoffice prices throughout were particularly sought after for extractive pur- poses.To do so,I start by estimating the change a repartimiento quotas were set at the end of the office. in the prices paid for rent-rich offices when selec- selling period(1754),they may only capture profitable provinces at tivity is low (war)relative to when it is higher that date.To alleviate this concern,I cross-check whether these quo- (peace)for particularly profitable provinces relative tas actually reflect repartimiento by examining the letters sent by ev- ery priest of the Cusco region between 1689 and 1690 denouncing to those less so.Because Peruvian province funda- this practice.Figure A.4 and discussion in the Appendix shows that mentals and profitability are unlikely to vary with Eu- the 1754 repartimiento quotas are also a good proxy of these activities ropean wars-and buyers could improve the likeli- taking place at the start of the office-selling period (1690). hood of securing a position by offering higher prices- 975Office-Selling, Corruption, and Long-Term Development in Peru FIGURE 1. Current Districts and Office Prices contemporary districts in Peru.12 As noted, provinces in the highest price quartile do not necessarily cluster geographically. To account for variation in the selectivity criteria of the Crown, I use warfare in Europe involving Spain as a source of exogenous variation in fiscal needs. WarLengtht is coded as the duration of years in a given war, under the assumption that longer wars tend to drain the treasury more. The Nine Years’ War, for example, lasted from 1688 until 1697; hence, 1688 is coded as one, 1689 as two, and so on, and the first year of peace is coded as 0. The online appendix describes the European wars included. Given the lack of time-varying information on profitability, I use the monetary value of the merchandise assigned to trade with the indigenous population (repartimiento) by the 1754 legalization decree (Moreno 1977). The idea is that higher quotas proxy for more repartimiento taking place.13 Other potential 12 Figure A.3 illustrates the time-variation in office prices throughout the period. 13 Because repartimiento quotas were set at the end of the officeselling period (1754), they may only capture profitable provinces at that date. To alleviate this concern, I cross-check whether these quotas actually reflect repartimiento by examining the letters sent by every priest of the Cusco region between 1689 and 1690 denouncing this practice. Figure A.4 and discussion in the Appendix shows that the 1754 repartimiento quotas are also a good proxy of these activities taking place at the start of the office-selling period (1690). measures of office profitability (e.g., agricultural suitability, indicator for market hubs, forced labor assignment, and the presence of mines) included in the analysis are described in the Appendix. Data on district-level public good provision comes from the 2007 census by INEI. Other geographic variables such as latitude, longitude, distance to Lima, and elevation (in meters over sea level) comes from the Ministry of Education. Finally, to look at household consumption, individual political attitudes and ethnic composition, I use the 2013 national household census (ENAHO),which includes a sample of around 14,000+ head of households representing 47 out of the 48 colonial provinces studied. Because differences in development could be reflecting differences prior to the office-selling episode, I also collected taxation, budgetary, and demographic data from settlements within colonial provinces (reducciones) dating from the first census conducted in Peru between 1571 and 1573 (Miranda 1873). These measures provide a baseline against which to compare subsequent economic changes in Peru’s corregimientos (provinces) plausibly driven by colonial governors. The proposed channel of persistence is the heightened political conflict prevailing in provinces since colonial times. Therefore, I use province-level data on the number and type of rebellions occurring throughout the eighteenth century (O’Phelan 1988; Golte 1980). These sources distinguish whether the rebellion is against a provincial governor (corregidor) or against other actors. I also use more contemporary data on conflict collected by the Peruvian Truth and Reconciliation Commission (CVR), which recorded individual level data on the early patterns of violence by Maoist guerrillas during the Peruvian civil conflict (1980– 2000). Finally, measures of historical income and ethnic composition come from several sources: the 1780 data comes from Vollmer (1967); 1827 measures of GDP and population were estimated by De Marzi and Diaz (2014); the 1876 ethnic composition data comes from the central statistics office (Direccion de estadistica del Peru 1878); and finally, contemporary information on ethnic identity and language comes from the 2013 ENAHO survey. Additional details of other variables and descriptive statistics are included in the Appendix. PRICES FOR GOVERNORSHIPS AND EXTRACTION In this section, I examine whether certain provinces were particularly sought after for extractive purposes. To do so, I start by estimating the change in the prices paid for rent-rich offices when selectivity is low (war) relative to when it is higher (peace) for particularly profitable provinces relative to those less so. Because Peruvian province fundamentals and profitability are unlikely to vary with European wars—and buyers could improve the likelihood of securing a position by offering higher prices— 975 Downloaded from https://www.cambridge.org/core. Shanghai JiaoTong University, on 26 Oct 2018 at 03:53:05, subject to the Cambridge Core terms of use, available at https://www.cambridge.org/core/terms. https://doi.org/10.1017/S000305541800045X