正在加载图片...
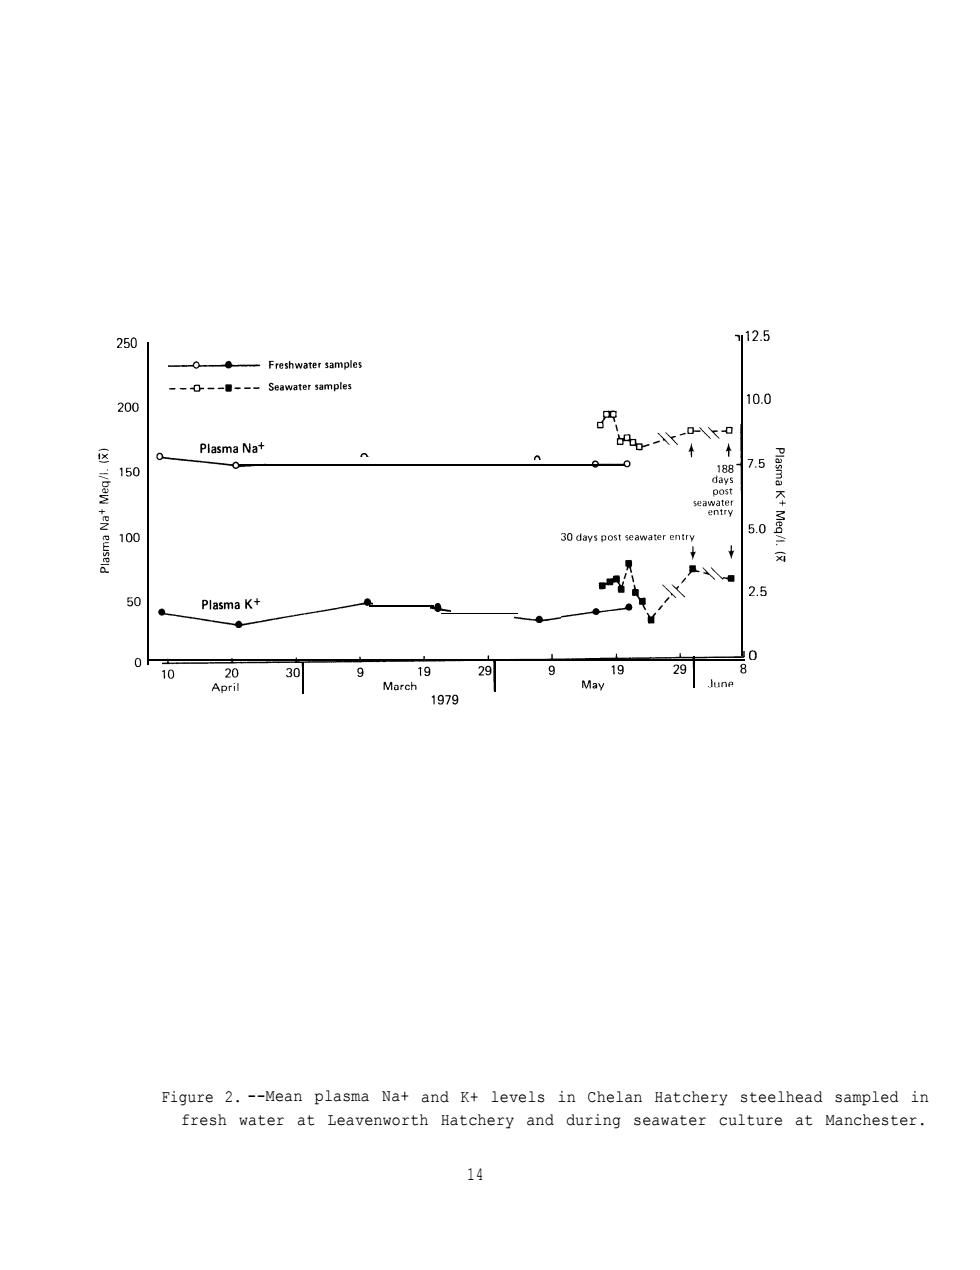
250 12.5 -------Seawater samples 200 10.0 Plasma Nat 150 75 100 30 days 2.5 Plasma K+ 10 30■ 29 1979 Figure 2.--Mean plasma Na+and K+levels in Chelan Hatchery steelhead sampled in fresh water at Leavenworth Hatchery and during seawater culture at Manchester. 14Figure 2. --Mean plasma Na+ and K+ levels in Chelan Hatchery steelhead sampled in fresh water at Leavenworth Hatchery and during seawater culture at Manchester. 14