正在加载图片...

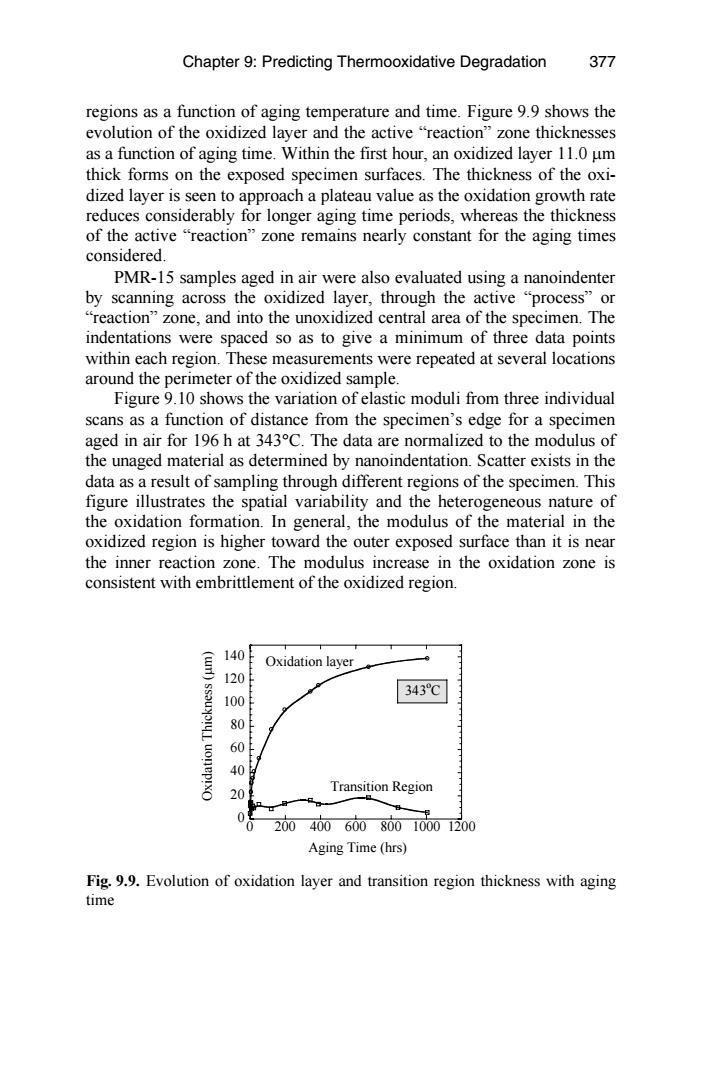
Chapter 9:Predicting Thermooxidative Degradation 377 regions as a function of aging temperature and time.Figure 9.9 shows the evolution of the oxidized layer and the active "reaction"zone thicknesses as a function of aging time.Within the first hour,an oxidized layer 11.0 um thick forms on the exposed specimen surfaces.The thickness of the oxi- dized layer is seen to approach a plateau value as the oxidation growth rate reduces considerably for longer aging time periods,whereas the thickness of the active "reaction"zone remains nearly constant for the aging times considered. PMR-15 samples aged in air were also evaluated using a nanoindenter by scanning across the oxidized layer,through the active "process"or "reaction"zone,and into the unoxidized central area of the specimen.The indentations were spaced so as to give a minimum of three data points within each region.These measurements were repeated at several locations around the perimeter of the oxidized sample. Figure 9.10 shows the variation of elastic moduli from three individual scans as a function of distance from the specimen's edge for a specimen aged in air for 196 h at 343C.The data are normalized to the modulus of the unaged material as determined by nanoindentation.Scatter exists in the data as a result of sampling through different regions of the specimen.This figure illustrates the spatial variability and the heterogeneous nature of the oxidation formation.In general,the modulus of the material in the oxidized region is higher toward the outer exposed surface than it is near the inner reaction zone.The modulus increase in the oxidation zone is consistent with embrittlement of the oxidized region. 140 Oxidation layer 120 343℃ 100 0 60 40 20 Transition Region 20040060080010001200 Aging Time (hrs) Fig.9.9.Evolution of oxidation layer and transition region thickness with aging timeFig. 9.9. Evolution of oxidation layer and transition region thickness with aging time PMR-15 samples aged in air were also evaluated using a nanoindenter by scanning across the oxidized layer, through the active “process” or “reaction” zone, and into the unoxidized central area of the specimen. The indentations were spaced so as to give a minimum of three data points Figure 9.10 shows the variation of elastic moduli from three individual scans as a function of distance from the specimen’s edge for a specimen aged in air for 196 h at 343°C. The data are normalized to the modulus of the unaged material as determined by nanoindentation. Scatter exists in the data as a result of sampling through different regions of the specimen. This oxidized region is higher toward the outer exposed surface than it is near the inner reaction zone. The modulus increase in the oxidation zone is consistent with embrittlement of the oxidized region. 0 20 40 60 80 100 120 140 0 200 400 600 800 1000 1200 Oxidation Thickness (µm) Aging Time (hrs) Oxidation layer Transition Region 343o C within each region. These measurements were repeated at several locations around the perimeter of the oxidized sample. thick forms on the exposed specimen surfaces. The thickness of the oxidized layer is seen to approach a plateau value as the oxidation growth rate reduces considerably for longer aging time periods, whereas the thickness of the active “reaction” zone remains nearly constant for the aging times considered. regions as a function of aging temperature and time. Figure 9.9 shows the evolution of the oxidized layer and the active “reaction” zone thicknesses as a function of aging time. Within the first hour, an oxidized layer 11.0 µm Chapter 9: Predicting Thermooxidative Degradation figure illustrates the spatial variability and the heterogeneous nature of the oxidation formation. In general, the modulus of the material in the 377