正在加载图片...
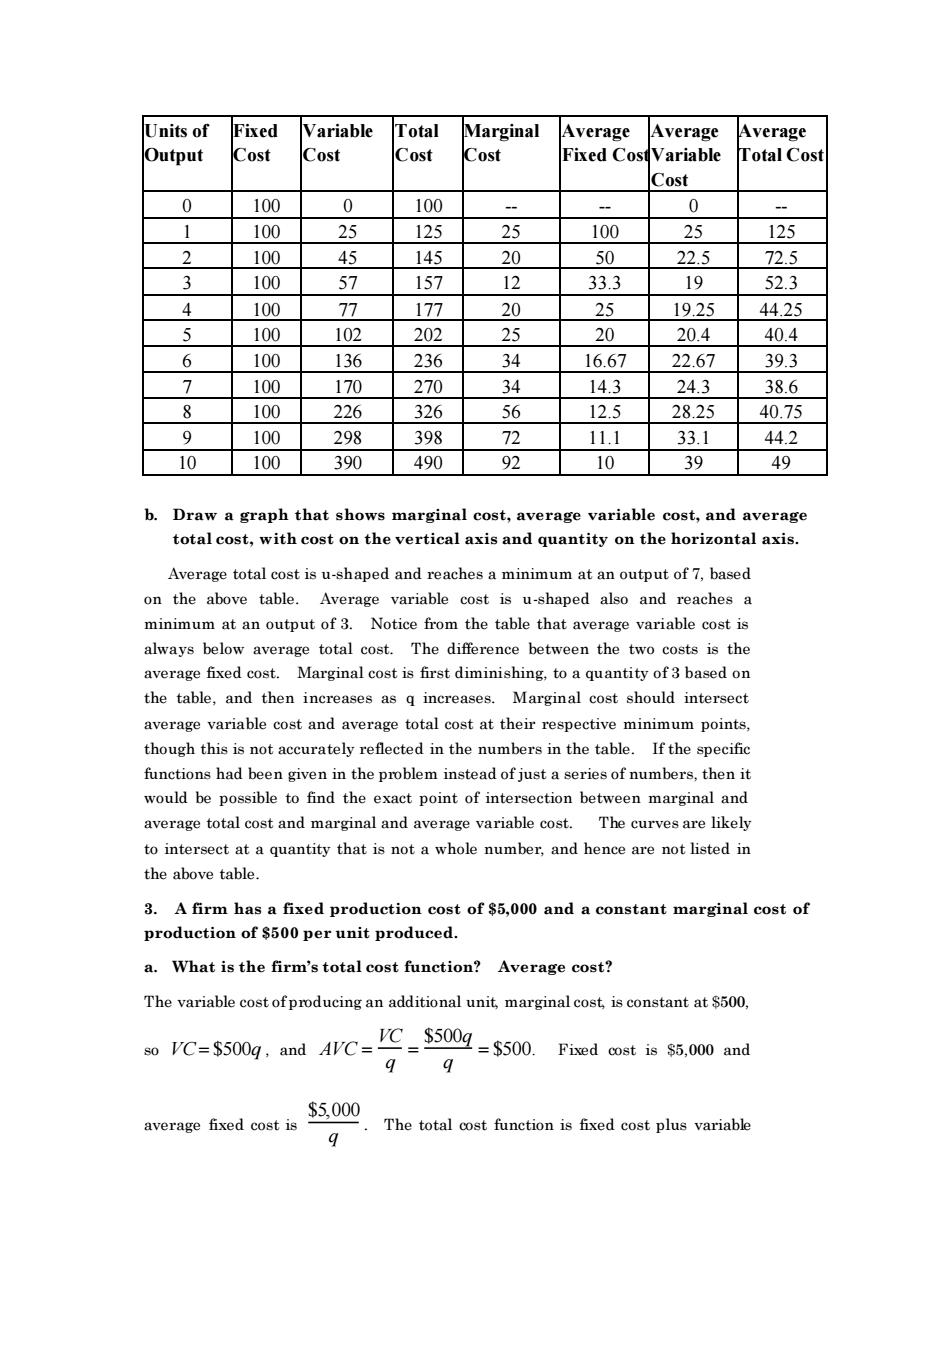
Units of Fixed Variable Total Marginal Average Outpu otal 05 100 0 100 0 100 )5 )5 100 125 100 1 1A5 75 100 5 15 33. 52.3 100 77 177 20 25 19.2544.25 100 107 20 20 20.4 404 100 136 236 16.67 67 39.3 100 170 270 34 14. 24.3 38.6 100 226 326 56 12.5 282540.75 0 100 20R 398 7 111 331 442 10 100 390 490 92 10 39 b.Draw a graph that shows marginal cost,average variable cost,and average total cost,with cost on the vertical axis and quantity on the horizontal axis. Average total cost is u-shaped and reaches a minimum at an output of 7.based on the above table. Average variable cost is u-shaped also and reaches a minimum at an output of. Notice from the table that aver variable cost always below average total cost. The difference between the two costs is the average fixed cost.Marginal cost is first diminishing,to a quantity of 3 based on the table.and then increases as g increases.Marginal cost should intersect average variable cost and average total cost at their respective minimum points though this is not curately in the table.If the functions had been given in the probem instead of just a seriesof numbers then i would be possible to find the exact point of intersection between marginal and average total cost and marginal and average variable cost,The curves are likely to intersect at a quantity that is not a whole number.and hence are not listed in the above table. 3.A firm has a fixed production cost of 5,000 and a constant marginal cost of production of $500 per unit produced. a.What is the firm's total cost function?Average cost? The variable cost of producing an additional unit marginal cost is constant at$500. VC=550g.and C=C==5500.s.00 ad 55,000 average fixed cost is The total ost function is fixed cost plus variable Units of Output Fixed Cost Variable Cost Total Cost Marginal Cost Average Fixed Cost Average Variable Cost Average Total Cost 0 100 0 100 - - 0 - 1 100 25 125 25 100 25 125 2 100 45 145 20 50 22.5 72.5 3 100 57 157 12 33.3 19 52.3 4 100 77 177 20 25 19.25 44.25 5 100 102 202 25 20 20.4 40.4 6 100 136 236 34 16.67 22.67 39.3 7 100 170 270 34 14.3 24.3 38.6 8 100 226 326 56 12.5 28.25 40.75 9 100 298 398 72 11.1 33.1 44.2 10 100 390 490 92 10 39 49 b. Draw a graph that shows marginal cost, average variable cost, and average total cost, with cost on the vertical axis and quantity on the horizontal axis. Average total cost is u-shaped and reaches a minimum at an output of 7, based on the above table. Average variable cost is u-shaped also and reaches a minimum at an output of 3. Notice from the table that average variable cost is always below average total cost. The difference between the two costs is the average fixed cost. Marginal cost is first diminishing, to a quantity of 3 based on the table, and then increases as q increases. Marginal cost should intersect average variable cost and average total cost at their respective minimum points, though this is not accurately reflected in the numbers in the table. If the specific functions had been given in the problem instead of just a series of numbers, then it would be possible to find the exact point of intersection between marginal and average total cost and marginal and average variable cost. The curves are likely to intersect at a quantity that is not a whole number, and hence are not listed in the above table. 3. A firm has a fixed production cost of $5,000 and a constant marginal cost of production of $500 per unit produced. a. What is the firm’s total cost function? Average cost? The variable cost of producing an additional unit, marginal cost, is constant at $500, so VC= $500q , and AVC = VC q = $500q q = $500. Fixed cost is $5,000 and average fixed cost is $5,000 q . The total cost function is fixed cost plus variable